
Minas Americas · Metallurgy and product pathway
Grade attracts attention. Recovery decides whether it matters.
SGS bench work covers seven geological samples from four auger holes plus one quality-control duplicate. Leach liquor, two separately analysed washes and residue were tested. Reporting of the SGS bench-scale results is the next milestone, after results reconciliation and technical review.
Bench-scale programme
The next milestone connects grades with process-development decisions.
Reporting of the SGS bench-scale results is the next milestone, after results reconciliation and technical review.
SGS bench work covers seven geological samples from four auger holes plus one quality-control duplicate. Leach liquor, two separately analysed washes and residue were tested.
The programme characterises feed, leach liquor, each wash and solid residue, with reagent and filtration records, to guide extraction selectivity and solid–liquid separation work.
The earlier diagnostic intervals and this bench programme use different samples and preparation conditions. They are not a before-and-after demonstration of improved recovery.
No numerical results from this programme are disclosed here. An optimised flowsheet and commercial recovery have not been established; timing and outcomes are not guaranteed.
Read the current technical sourceHistorical diagnostic method · 2025 context
From selected clay sample to solution analysis.
The current disclosure reports diagnostic quantities on the laboratory mg/kg basis and compares the head and dissolved rare-earth mix. Those comparisons describe composition, not extraction recovery. The historical diagram below is not a representation of the later bench programme.
-
01Solid inputSelected interval sample
Prepared, screened laboratory material. The total head assay is a separate measurement of the solid.
Head assay matrix · ppm in solid -
02Defined conditionSingle laboratory contact
Ammonium ions exchange with some surface-bound rare-earth ions under one stated test condition.
Diagnostic test · not a plant flowsheet -
03Liquid outputPrimary leach solution
The liquid after contact is collected as PLS. It is a test solution, not a product.
Solid residue · required for full mass balance -
04Measured resultICP-MS solution analysis
Elements measured in PLS are expressed as oxide-equivalent DREO totals, including the MREO subset.
Diagnostic result · mg/kg of PLS
Some rare-earth elements entered solution under the stated condition, supporting ionic-adsorption behaviour in the selected tested samples.
Extraction or recovery percentage, representativeness, complete mass balance, a commercial flowsheet, a product specification or project economics.
Selected diagnostic screening; not optimised. DREO = desorbable rare-earth oxides. MREO = Nd, Pr, Dy and Tb oxides. Sources: SGS certificate GQ2509212 and technical disclosure dated 21 October 2025. Solution concentration is not recovery.
Selected shallow diagnostic leach results
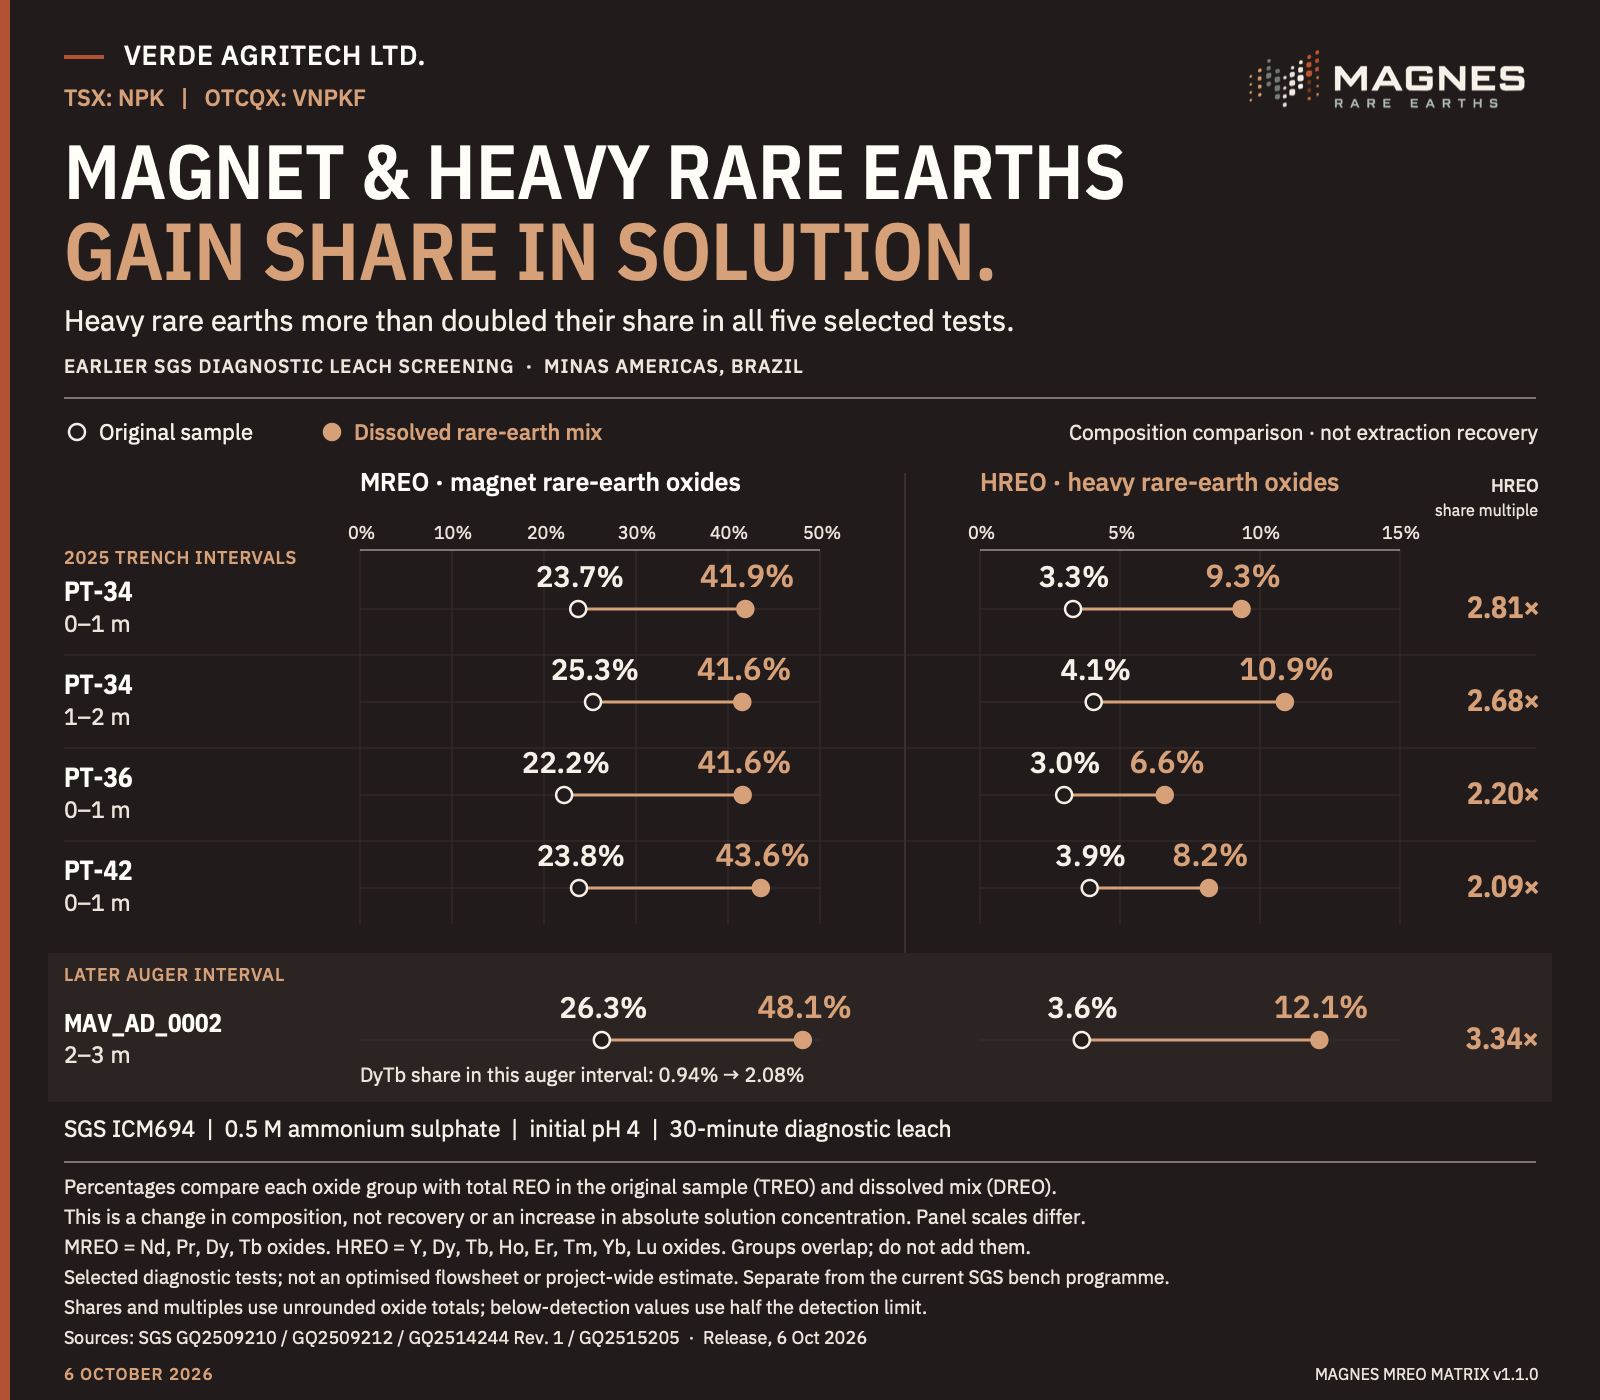
Magnet and heavy rare earths gain share in solution. Figure 2 from the 6 October 2026 release: four selected 2025 trench intervals, plus a later auger interval. HREO represented 6.6–12.1% of the dissolved rare-earth mix, compared with 3.0–4.1% in the original samples.
These are composition shares, not extraction recovery or an increase in absolute solution concentration. MREO and HREO overlap through DyTb and must not be added. Selected diagnostic tests are separate from the current SGS bench programme and do not establish an optimised flowsheet or project-wide recovery.
Read the graphic values as a table
| Selected interval | MREO · original | MREO · dissolved | HREO · original | HREO · dissolved | HREO share multiple |
|---|---|---|---|---|---|
| PT-34 · 0–1 m | 23.7% | 41.9% | 3.3% | 9.3% | 2.81× |
| PT-34 · 1–2 m | 25.3% | 41.6% | 4.1% | 10.9% | 2.68× |
| PT-36 · 0–1 m | 22.2% | 41.6% | 3.0% | 6.6% | 2.20× |
| PT-42 · 0–1 m | 23.8% | 43.6% | 3.9% | 8.2% | 2.09× |
| MAV_AD_0002 · 2–3 m (later auger) | 26.3% | 48.1% | 3.6% | 12.1% | 3.34× |
Later auger interval DyTb share: 0.94% → 2.08%. Shares and multiples use unrounded oxide totals; below-detection values use half the detection limit. SGS ICM694: 0.5 M ammonium sulphate, initial pH 4, 30 minutes. MREO comprises Nd, Pr, Dy and Tb oxides; HREO comprises Y, Dy, Tb, Ho, Er, Tm, Yb and Lu oxides. The graphic panels use different scales.
Diagnostic composition · October source basis
These are the five selected historical diagnostic intervals, not the seven geological samples in the separate SGS bench-scale programme. Values describe desorbed oxide equivalents on the laboratory mg/kg reporting basis—not increased absolute solution concentration or recovery.
| Interval | MREO (mg/kg) | DREO (mg/kg) | MREO share of DREO |
|---|---|---|---|
| PT-34 · 0–1 m | 161 | 384 | 41.9% |
| PT-34 · 1–2 m | 240 | 578 | 41.6% |
| PT-36 · 0–1 m | 278 | 667 | 41.6% |
| PT-42 · 0–1 m | 167 | 383 | 43.6% |
| MAV_AD_0002 · 2–3 m | 237 | 492 | 48.1% |
The October source reports PT-34 0–1 m DREO using half detection limits; the reconciled figure is shown above, while the earlier graphic remains unchanged in the dated archive below. MREO and HREO overlap through DyTb and must not be added. Composition is not extraction recovery or commercial process performance.
Historical diagnostic graphic and technical plate · original reporting basis
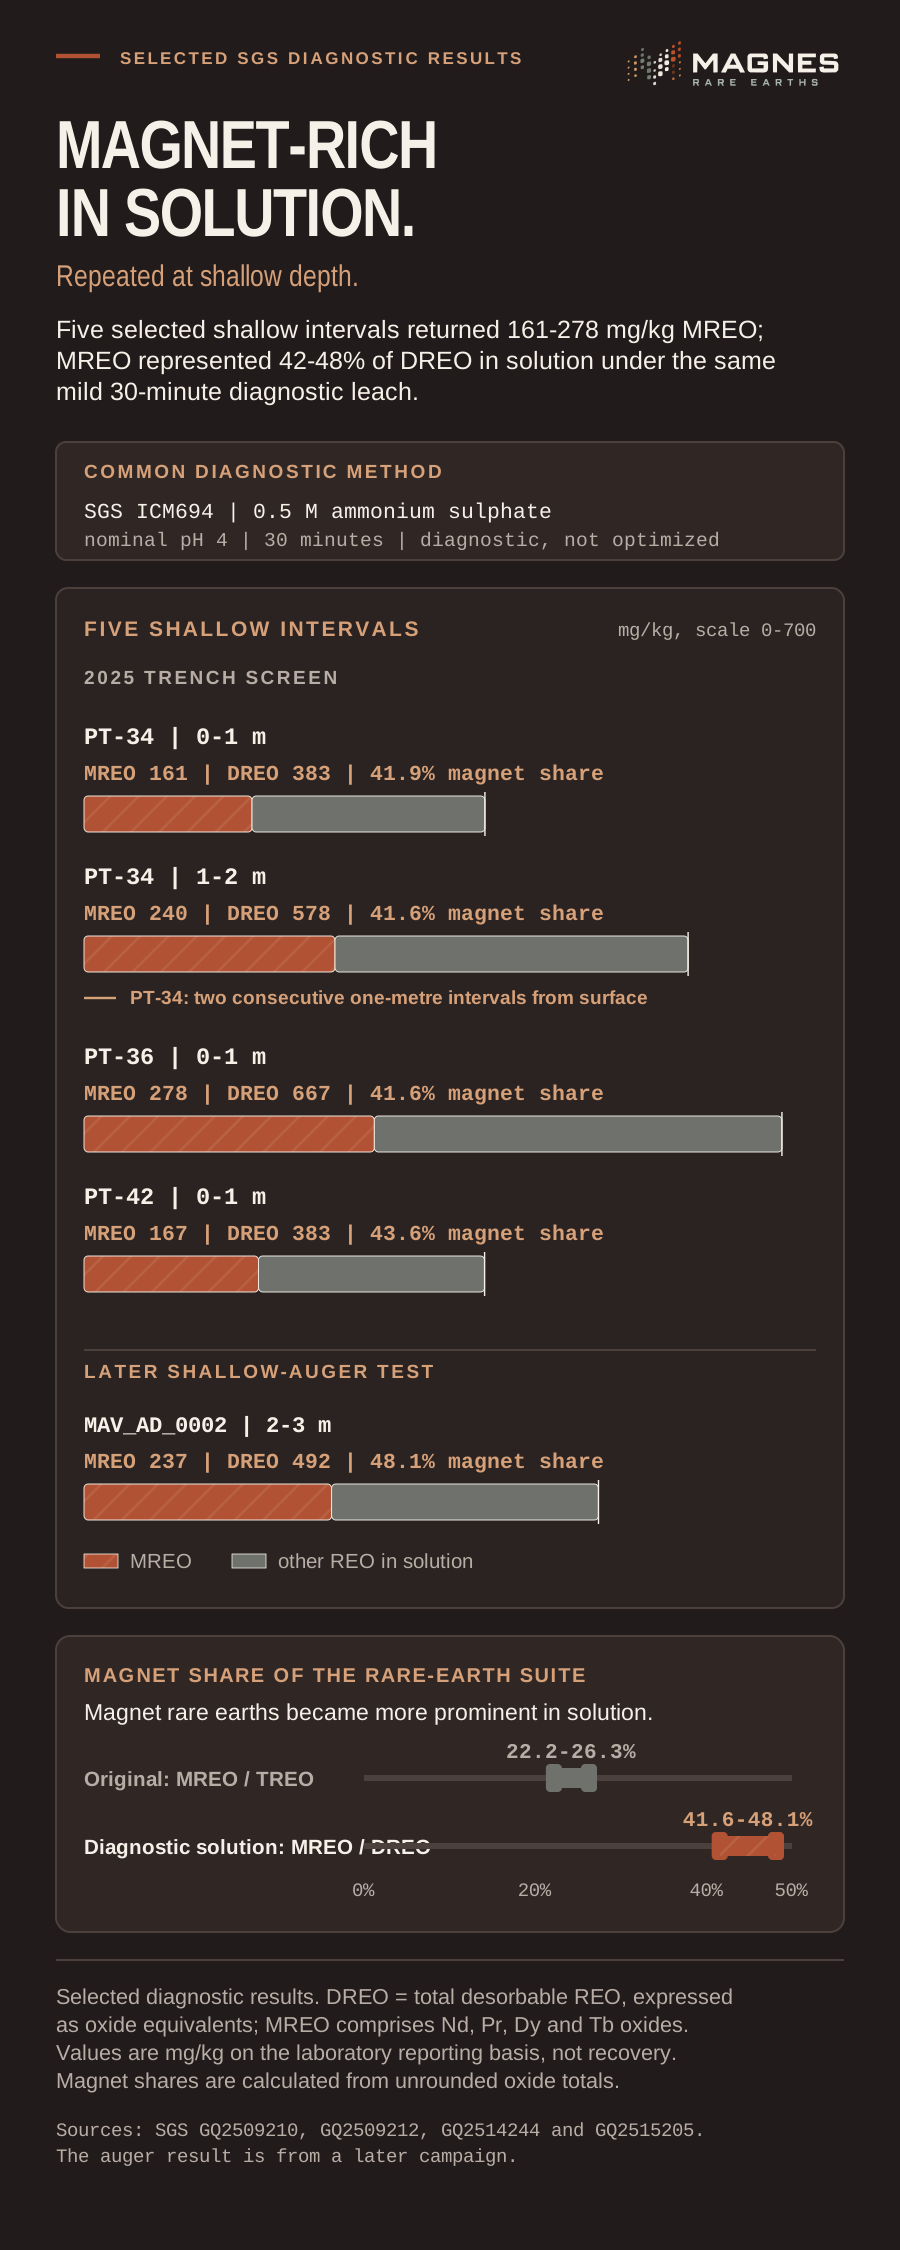
This is the unchanged earlier illustration, not the October source table or the new SGS bench results. Its original reporting basis must be read in that dated context.
Accessible data transcript (HTML)
Five selected shallow intervals tested using SGS ICM694: 0.5 M ammonium sulphate, nominal pH 4 and 30 minutes.
| Interval | MREO in solution | DREO in solution | MREO share of DREO |
|---|---|---|---|
| PT-34 · 0-1 m | 161 mg/kg | 383 mg/kg | 41.9% |
| PT-34 · 1-2 m | 240 mg/kg | 578 mg/kg | 41.6% |
| PT-36 · 0-1 m | 278 mg/kg | 667 mg/kg | 41.6% |
| PT-42 · 0-1 m | 167 mg/kg | 383 mg/kg | 43.6% |
| MAV_AD_0002 · 2-3 m | 237 mg/kg | 492 mg/kg | 48.1% |
Selected diagnostic results, not optimised or representative recovery tests. Values are solution concentrations, not recovery percentages. MREO comprises Nd, Pr, Dy and Tb oxides; DREO is expressed on an oxide-equivalent basis.
From assay to payability
Five distinct measures from rock to revenue.
Each step answers a different question, from what is present to what can be recovered, made and sold.
- 01
Head grade
What the original solid sample contains before processing. The June drilling results are head-grade assays.
- 02
Diagnostic solution result
What dissolved under one defined laboratory test. This is where the selected 2025 work sits.
- 03
Extraction or desorption percentage
The measured share of the original inventory transferred into solution, supported by sample mass, solution volume and mass balance.
- 04
Full flowsheet recovery
The share reaching a defined product after each process stage, including losses and recycle streams.
- 05
Payable recovery
The portion for which a customer would pay after specifications, impurities and commercial deductions.
A solid head assay and a concentration reported in mg/kg in solution cannot be divided to calculate recovery without the original sample mass, solution volume, solids-to-liquid ratio and complete mass balance.
Process streams
Build the complete flowsheet picture.
Representative work will reconcile rare earths and impurities across feed, solution, residue, losses and the selected product route.
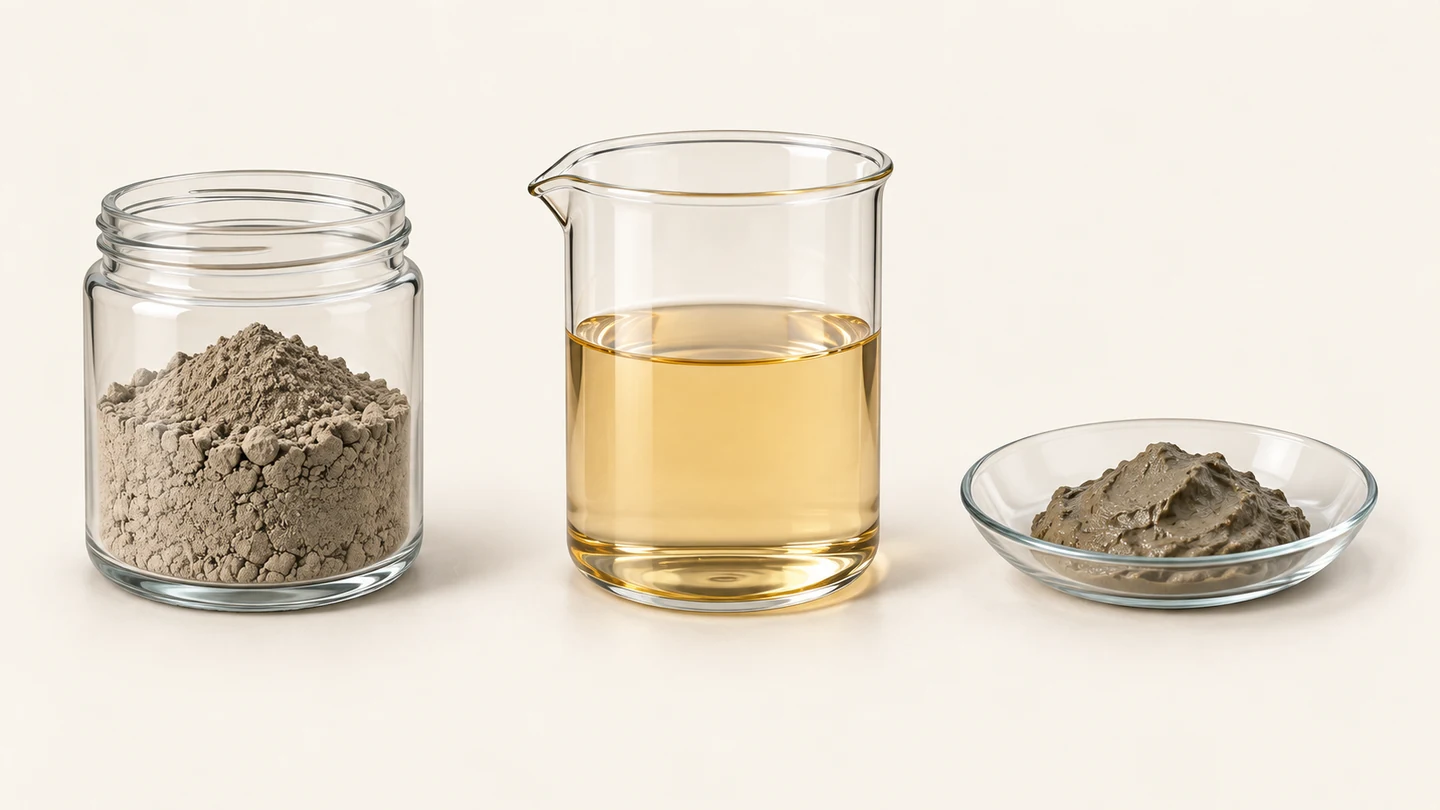
Conceptual laboratory compartments, not test results. The illustration does not show quantities or establish recovery.
Accessible data transcript (HTML)
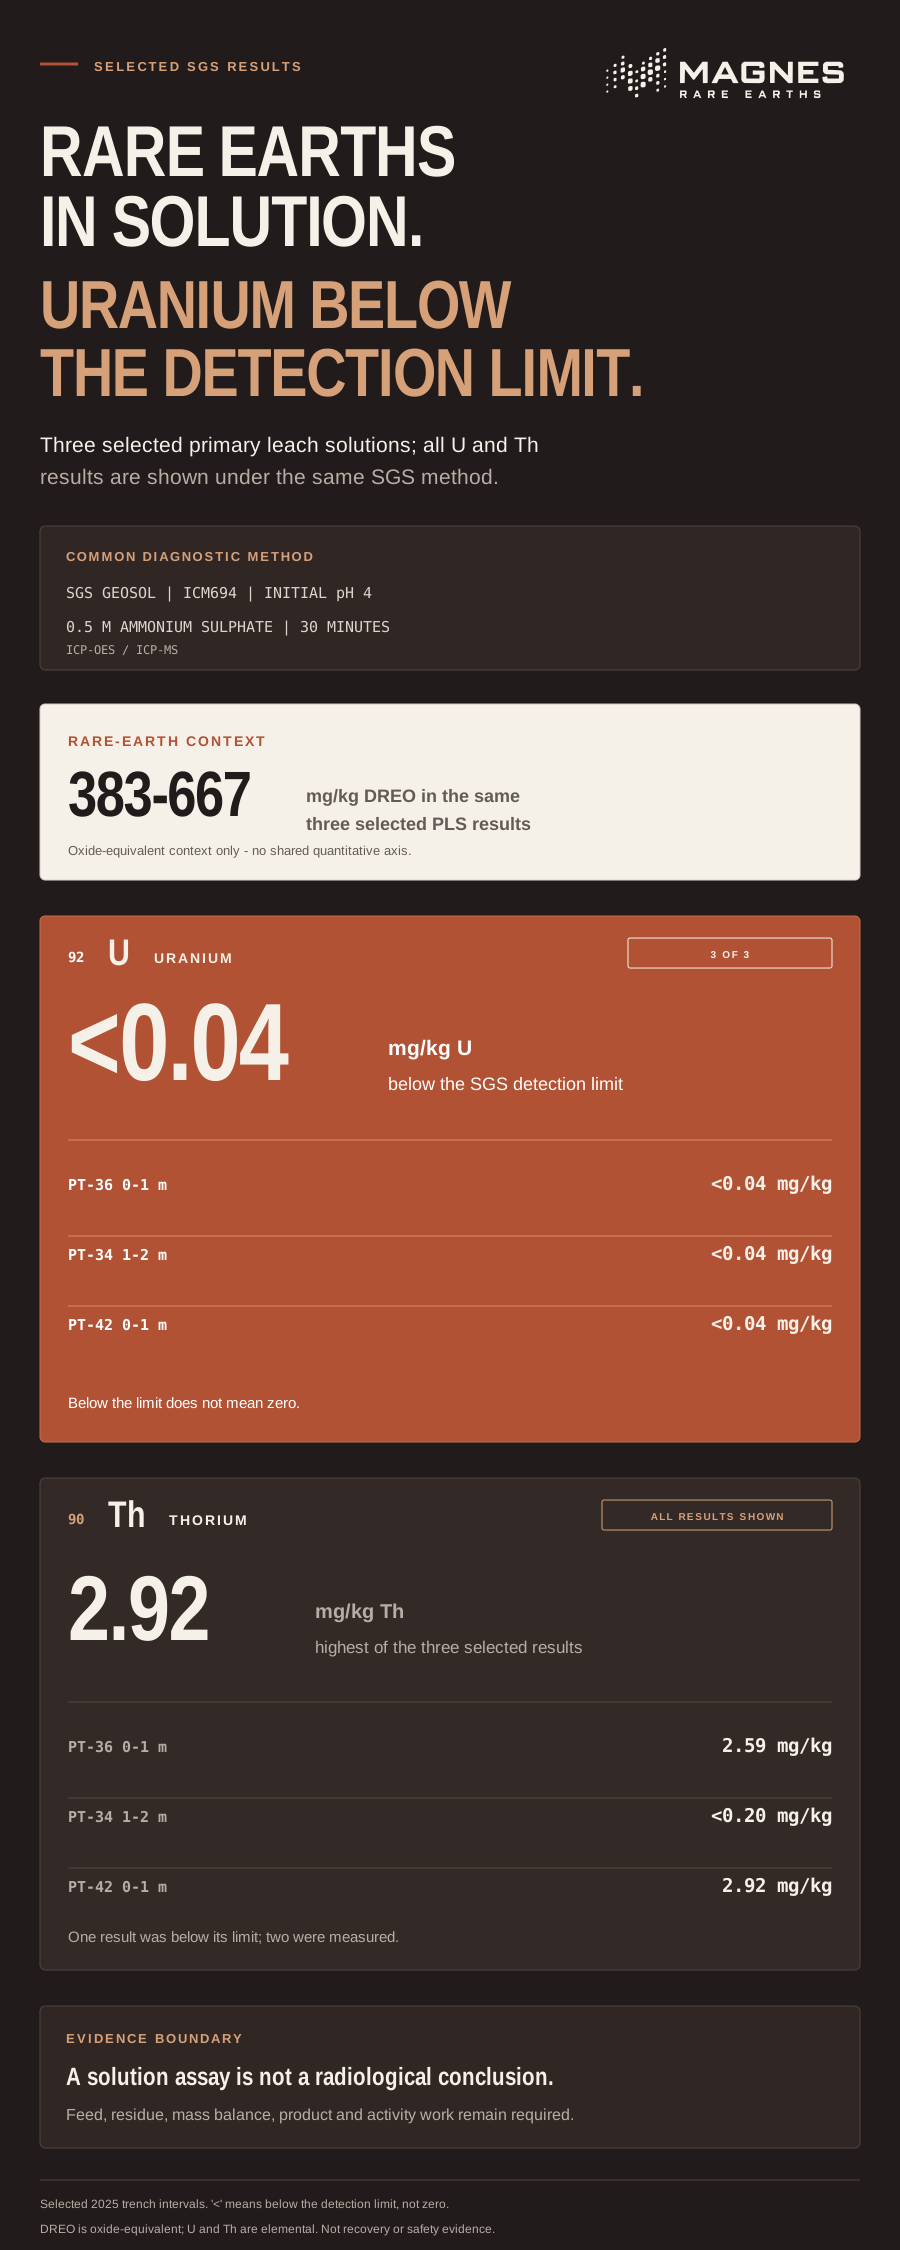
Selected SGS ICM694 primary leach solution results: 0.5 M ammonium sulphate, initial pH 4 and 30 minutes.
| Interval | DREO in PLS | Uranium | Thorium |
|---|---|---|---|
| PT-36 · 0-1 m | 667 mg/kg | <0.04 mg/kg U | 2.59 mg/kg Th |
| PT-34 · 1-2 m | 578 mg/kg | <0.04 mg/kg U | <0.20 mg/kg Th |
| PT-42 · 0-1 m | 383 mg/kg | <0.04 mg/kg U | 2.92 mg/kg Th |
A less-than sign means below the SGS laboratory detection limit, not zero. DREO is oxide-equivalent; U and Th are elemental concentrations. Selected diagnostic solution results, not a resource-average or representative radiological dataset. The concentrations do not characterise uranium or thorium in the feed, residue, water, workplace, potential product or property as a whole and do not establish transfer, recovery, mass balance, total radioactivity, product specification, environmental safety or commercial performance.
Radiological evidence
Build the complete radiological picture.
In three selected 2025 primary leach solutions, uranium was reported below 0.04 mg/kg in every result; thorium was reported at 2.59 mg/kg, below 0.20 mg/kg and 2.92 mg/kg.
The next step is representative feed–solution–residue–product characterisation with a complete mass balance and appropriate radiological measurements.
Product pathway
First define a product. Then test whether a customer can use it.
Representative mineralogy, element-by-element extraction, impurity behaviour and mass balance must come before a defensible product concept.
Only then can Magnes and potential partners assess purification, separation, qualification, realised pricing, capital and operating implications.
Discuss a relevant capabilityInvestment case
See how metallurgy changes the thesis.
Representative recovery, impurities and product definition will determine how much of the geological result can matter commercially.
See what changes the thesis