
SELECTED RC INTERVAL FROM SURFACEHEAD GRADE
MAV_RC_006330 m from surface
1,853 ppm MREO
Selected head-grade drilled intervalMinas Gerais, Brazil · Exploration stage
A magnet-rich rare-earth system, with Nd, Pr, Dy and Tb at the centre of the project's strategic focus, supported by 879 holes in the combined assay compilation.
MAV_RC_0063 returned 30 metres from surface at 1,853 ppm MREO, including 60 ppm DyTb, with 270 ppm HREO. MAV_AD_0691 returned 8 metres from surface at 2,194 ppm MREO; MAV_AD_0639 returned 11 metres from surface at 2,179 ppm MREO and 335 ppm HREO. These are selected cumulative auger profiles, not an all-new cohort.

30 m from surface
1,853 ppm MREO
Selected head-grade drilled interval7,468.8 m of compiled assays
from surface
from surface
Including 60 ppm DyTb
Selected head-grade drilled intervals, not recovered grades. True widths and continuity are not established. Nested intervals are included, not additional metres. MREO and HREO overlap through DyTb. Combined compilation: 879 holes / 7,468.8 assayed m. Separate drilling records: 1,191 holes / 12,640.6 recorded m; not a 2026-only physical-drilling total.
Field programme · Minas Americas
Drilling recorded through
Magnes is advancing the field programme at Minas Americas, with more than 12,000 metres drilled during 2026—a measure of drilling activity, separate from the assay results published to date.
The next step is to turn fieldwork into checked geological and assay data. Drilling metres alone do not establish mineralisation, continuity, a mineral resource or economic viability.
The 6 October 2026 release reports 879 holes and 7,468.8 m assayed cumulatively. Physical drilling and this dated assay population are different measures.
Read the published assay results
Drilling results · 6 October 2026
MAV_RC_0063 returned 30 metres from surface at 1,853 ppm MREO, including 60 ppm DyTb, with 270 ppm HREO. MAV_AD_0691 returned 8 metres from surface at 2,194 ppm MREO; MAV_AD_0639 returned 11 metres from surface at 2,179 ppm MREO and 335 ppm HREO. These are selected cumulative auger profiles, not an all-new cohort.
Data cutoff 25 September 2026. Combined assay compilation, coverage of this update and drilling-record totals are different populations. Selected head grades do not establish true widths, continuity, mineral resources, reserves, metallurgical recovery or economics. MREO and HREO overlap through DyTb. Companion-annex approval and new spatial collars are not asserted by this source selection.
Project + regional context
Minas Americas is in Minas Gerais, Brazil. Explore the published locations in the drill-hole map below; Verde regional reference locations are labelled separately and are not Magnes project infrastructure.
Explore the drill-hole mapSpatial disclosure record
Search published drill-hole IDs, compare disclosure rounds and inspect individual assay intervals and their issued sources. A collar is a location; each interval remains a separate observation tied to its own disclosure date.
Head-grade drilled intervals only. The map does not establish continuity, true thickness, a mineral resource or recovery.
Spatial disclosures through 6 October 2026. The preview and full map share the same data and controls. A separate dated archive retains June regional geography.
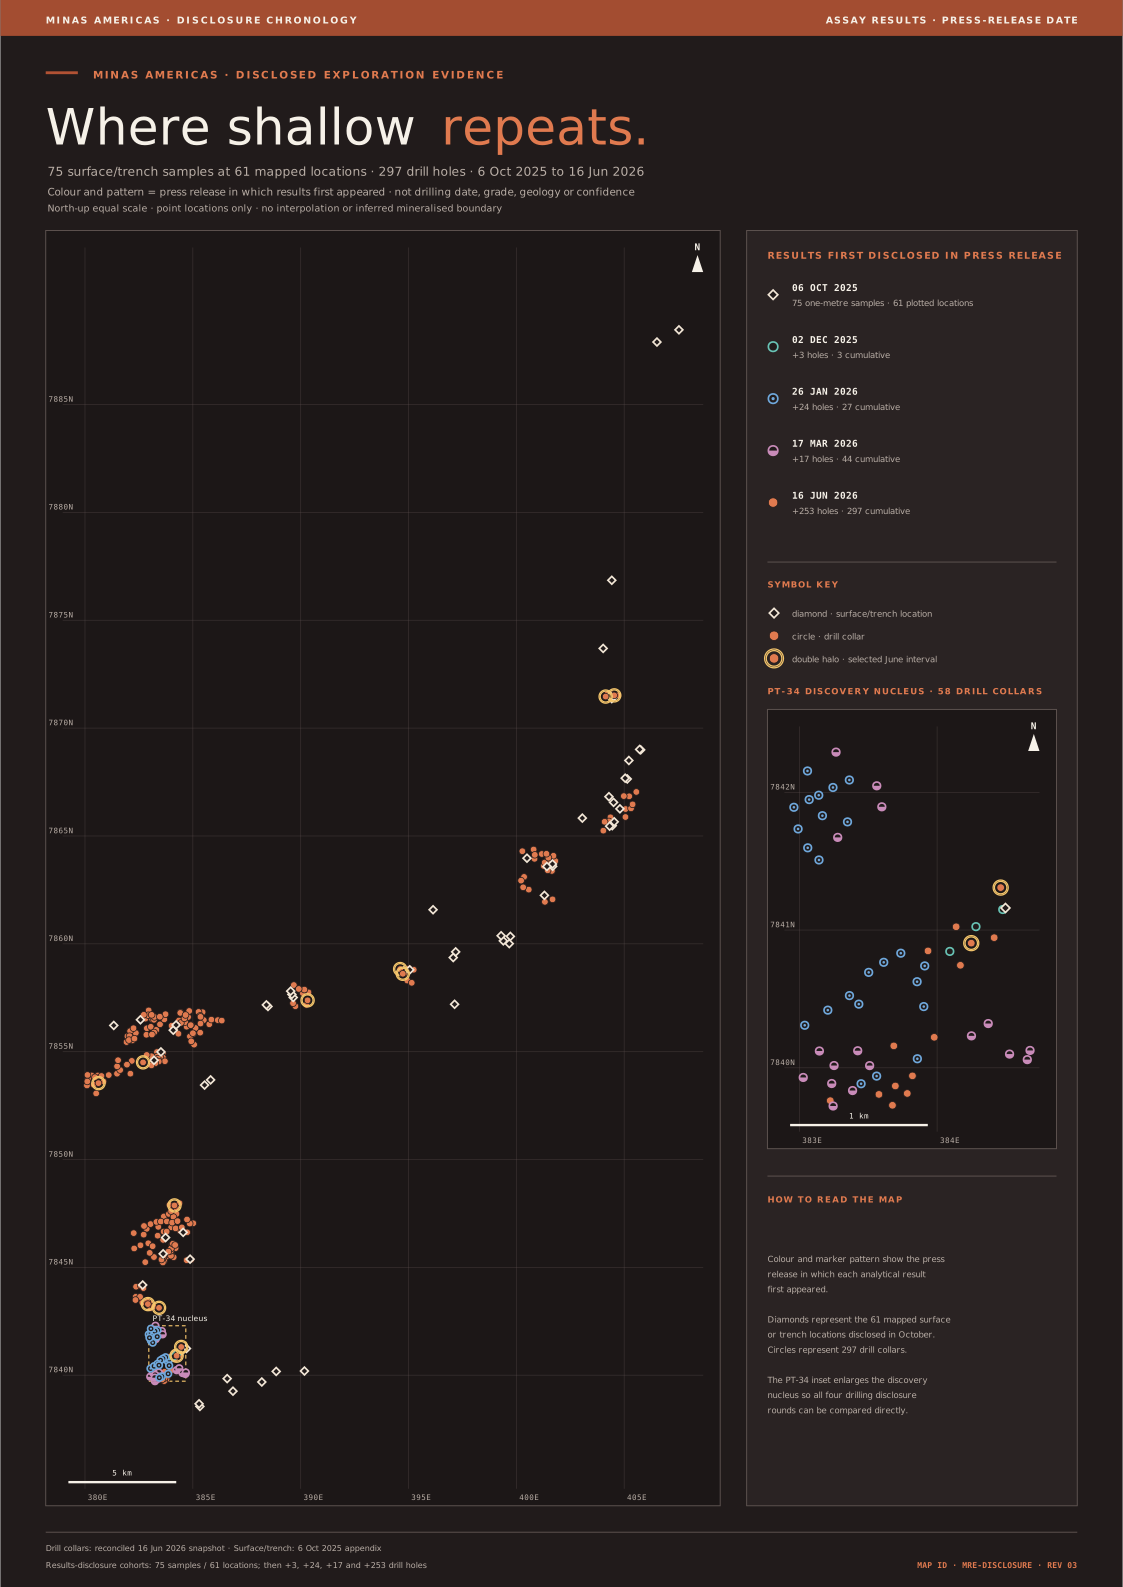
The visual below preserves the selected shallow intervals and 253-hole aggregate reported in the June update. It is retained as a dated part of the project record.
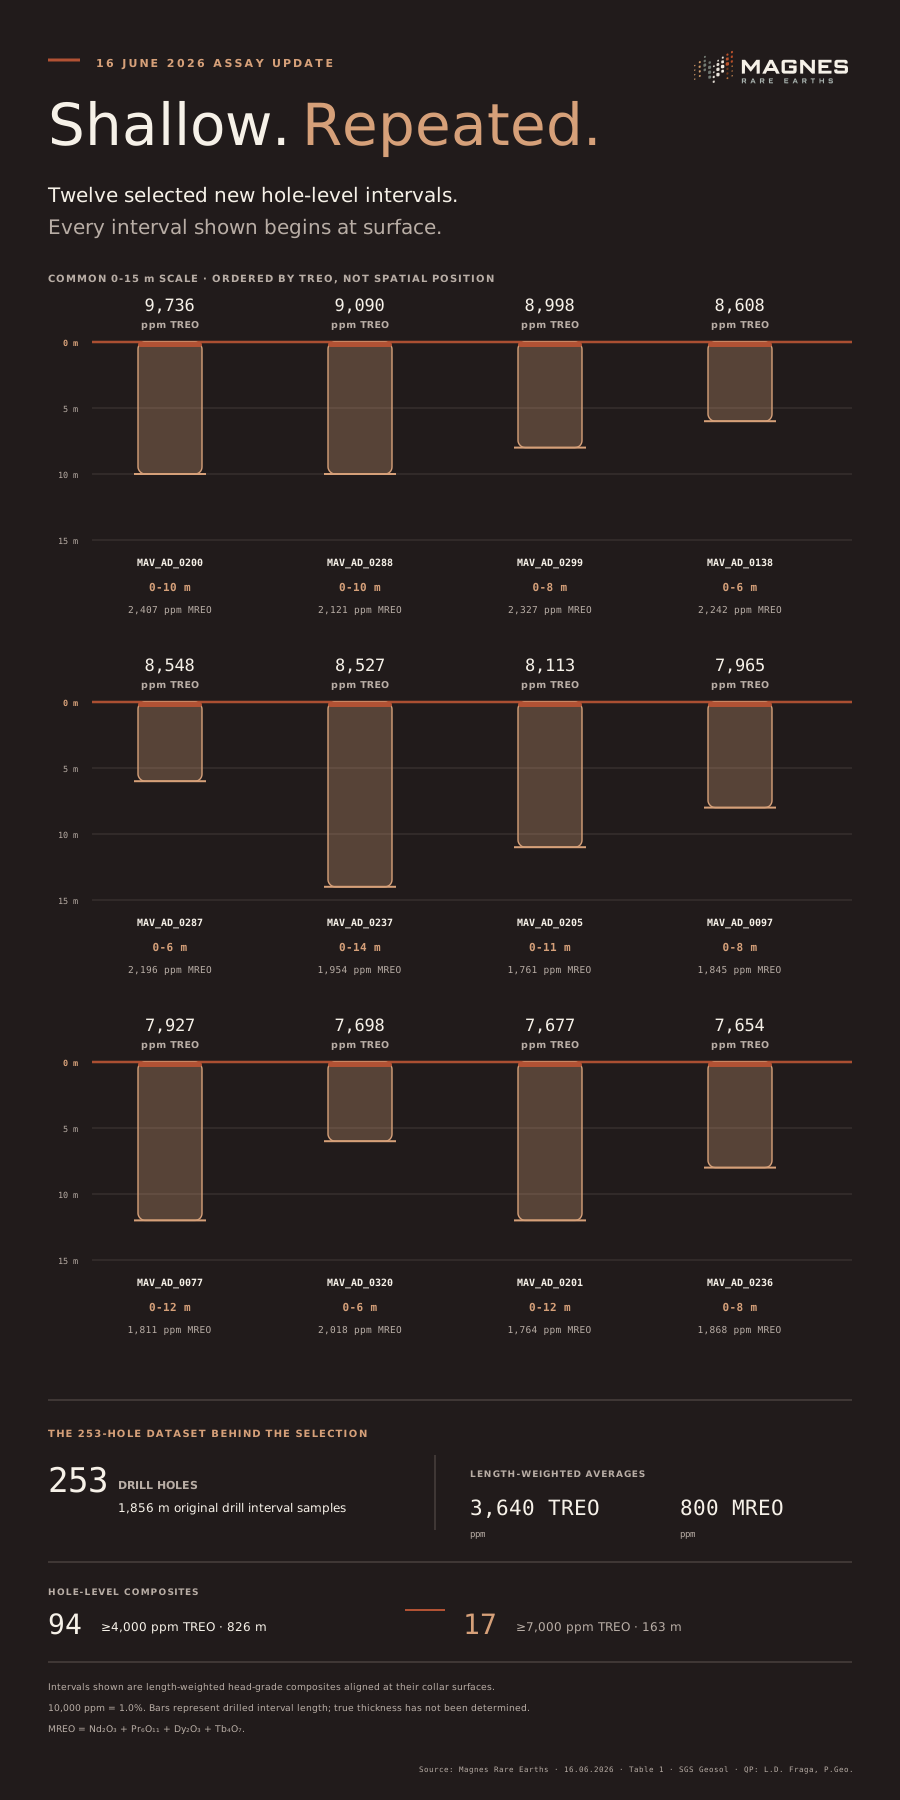
Table 1 of the 16 June 2026 release listed 12 selected new hole-level intervals, each beginning at surface, with drilled lengths from 6 to 14 metres. The rows remain ordered by TREO, not by spatial position.
| Hole | Drilled interval | TREO (ppm) | MREO (ppm) |
|---|---|---|---|
| MAV_AD_0200 | 0–10 m | 9,736 | 2,407 |
| MAV_AD_0288 | 0–10 m | 9,090 | 2,121 |
| MAV_AD_0299 | 0–8 m | 8,998 | 2,327 |
| MAV_AD_0138 | 0–6 m | 8,608 | 2,242 |
| MAV_AD_0287 | 0–6 m | 8,548 | 2,196 |
| MAV_AD_0237 | 0–14 m | 8,527 | 1,954 |
| MAV_AD_0205 | 0–11 m | 8,113 | 1,761 |
| MAV_AD_0097 | 0–8 m | 7,965 | 1,845 |
| MAV_AD_0077 | 0–12 m | 7,927 | 1,811 |
| MAV_AD_0320 | 0–6 m | 7,698 | 2,018 |
| MAV_AD_0201 | 0–12 m | 7,677 | 1,764 |
| MAV_AD_0236 | 0–8 m | 7,654 | 1,868 |
Across the 253-hole June dataset, the disclosed length-weighted averages were 3,640 ppm TREO and 800 ppm MREO. The 16 June 2026 release reported 94 hole-level composites at or above 4,000 ppm TREO over 826 metres, including 17 at or above 7,000 ppm TREO over 163 metres. All intervals shown are selected head-grade drilled lengths; true thickness has not been determined.
Selected results are head-grade drilled intervals. The release provides no mineral resource, recovery estimate, economics, production guidance or development decision. The later 8 September 2026 disclosure expands the reported drilling record.
Published section context
A schematic redraw of the published A–B section, showing four intervals reconciled to the assay tables.
MAV_AD_0012MAV_AD_0013MAV_AD_0002MAV_AD_0001SGS bench work covers seven geological samples from four auger holes plus one quality-control duplicate. Leach liquor, two separately analysed washes and residue were tested.
Reporting of the SGS bench-scale results is the next milestone, after results reconciliation and technical review.
No numerical results from this programme are disclosed here. An optimised flowsheet and commercial recovery have not been established; timing and outcomes are not guaranteed.
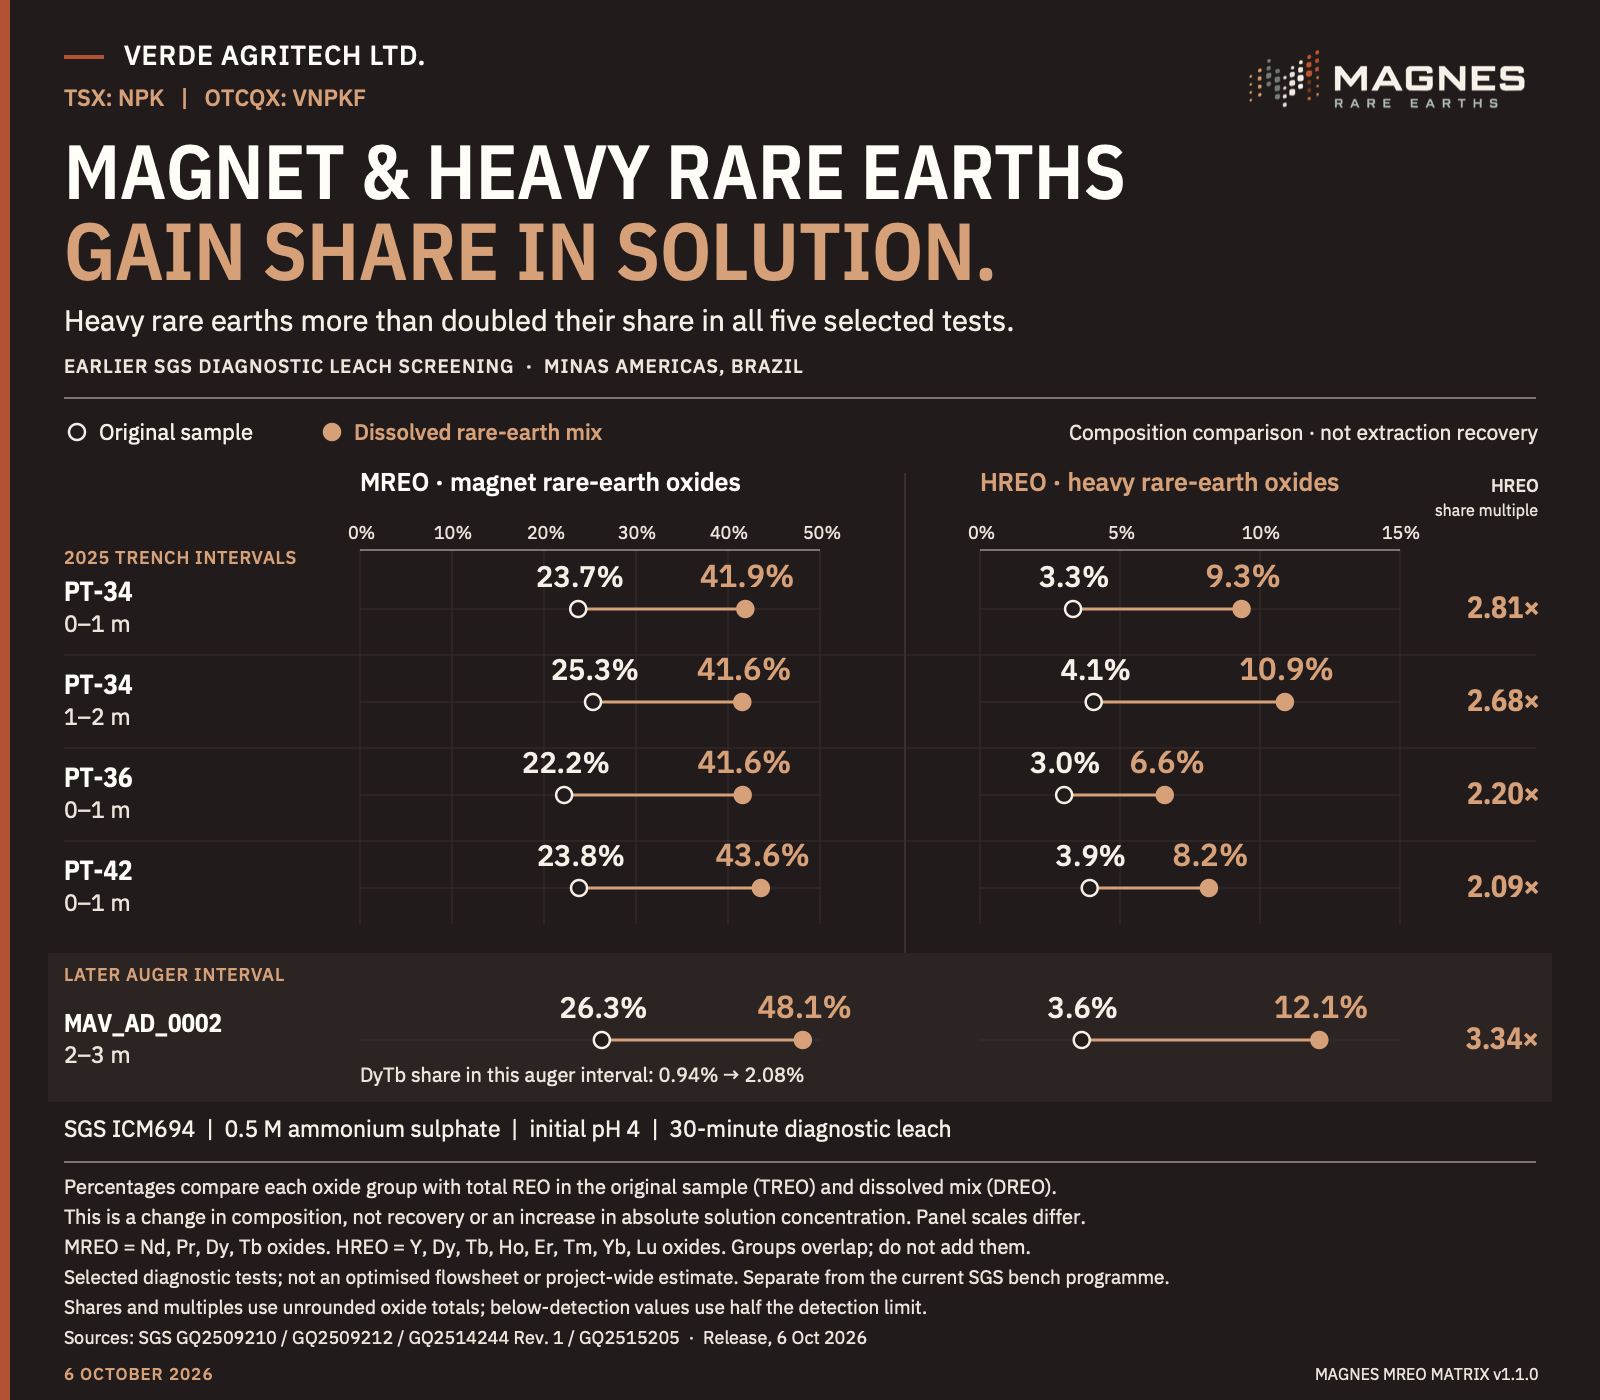
Magnet and heavy rare earths gain share in solution. Figure 2 from the 6 October 2026 release: four selected 2025 trench intervals, plus a later auger interval. HREO represented 6.6–12.1% of the dissolved rare-earth mix, compared with 3.0–4.1% in the original samples.
These are composition shares, not extraction recovery or an increase in absolute solution concentration. MREO and HREO overlap through DyTb and must not be added. Selected diagnostic tests are separate from the current SGS bench programme and do not establish an optimised flowsheet or project-wide recovery.
| Selected interval | MREO · original | MREO · dissolved | HREO · original | HREO · dissolved | HREO share multiple |
|---|---|---|---|---|---|
| PT-34 · 0–1 m | 23.7% | 41.9% | 3.3% | 9.3% | 2.81× |
| PT-34 · 1–2 m | 25.3% | 41.6% | 4.1% | 10.9% | 2.68× |
| PT-36 · 0–1 m | 22.2% | 41.6% | 3.0% | 6.6% | 2.20× |
| PT-42 · 0–1 m | 23.8% | 43.6% | 3.9% | 8.2% | 2.09× |
| MAV_AD_0002 · 2–3 m (later auger) | 26.3% | 48.1% | 3.6% | 12.1% | 3.34× |
Later auger interval DyTb share: 0.94% → 2.08%. Shares and multiples use unrounded oxide totals; below-detection values use half the detection limit. SGS ICM694: 0.5 M ammonium sulphate, initial pH 4, 30 minutes. MREO comprises Nd, Pr, Dy and Tb oxides; HREO comprises Y, Dy, Tb, Ho, Er, Tm, Yb and Lu oxides. The graphic panels use different scales.
These are the five selected historical diagnostic intervals, not the seven geological samples in the separate SGS bench-scale programme. Values describe desorbed oxide equivalents on the laboratory mg/kg reporting basis—not increased absolute solution concentration or recovery.
| Interval | MREO (mg/kg) | DREO (mg/kg) | MREO share of DREO |
|---|---|---|---|
| PT-34 · 0–1 m | 161 | 384 | 41.9% |
| PT-34 · 1–2 m | 240 | 578 | 41.6% |
| PT-36 · 0–1 m | 278 | 667 | 41.6% |
| PT-42 · 0–1 m | 167 | 383 | 43.6% |
| MAV_AD_0002 · 2–3 m | 237 | 492 | 48.1% |
The October source reports PT-34 0–1 m DREO using half detection limits; the reconciled figure is shown above, while the earlier graphic remains unchanged in the dated archive below. MREO and HREO overlap through DyTb and must not be added. Composition is not extraction recovery or commercial process performance.
This is the unchanged earlier illustration, not the October source table or the new SGS bench results. Its original reporting basis must be read in that dated context.
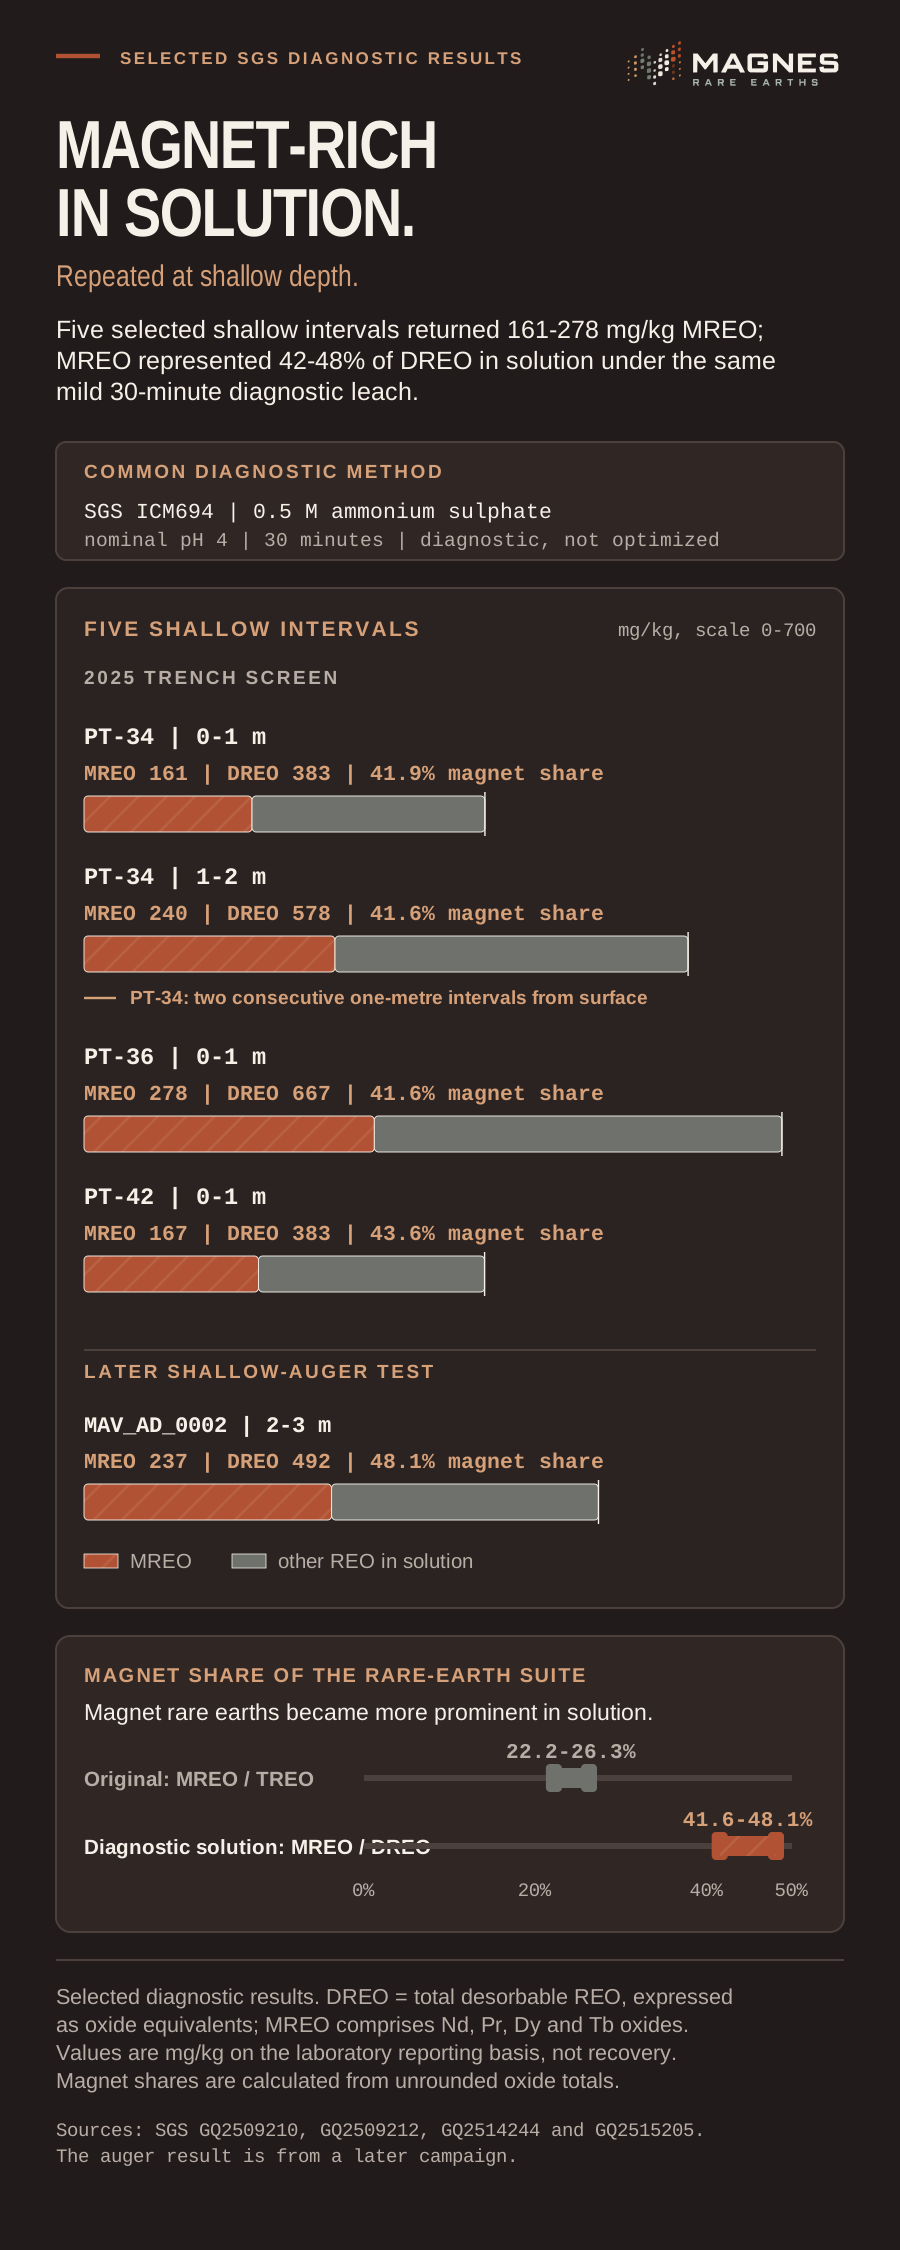
Five selected shallow intervals tested using SGS ICM694: 0.5 M ammonium sulphate, nominal pH 4 and 30 minutes.
| Interval | MREO in solution | DREO in solution | MREO share of DREO |
|---|---|---|---|
| PT-34 · 0-1 m | 161 mg/kg | 383 mg/kg | 41.9% |
| PT-34 · 1-2 m | 240 mg/kg | 578 mg/kg | 41.6% |
| PT-36 · 0-1 m | 278 mg/kg | 667 mg/kg | 41.6% |
| PT-42 · 0-1 m | 167 mg/kg | 383 mg/kg | 43.6% |
| MAV_AD_0002 · 2-3 m | 237 mg/kg | 492 mg/kg | 48.1% |
Selected diagnostic results, not optimised or representative recovery tests. Values are solution concentrations, not recovery percentages. MREO comprises Nd, Pr, Dy and Tb oxides; DREO is expressed on an oxide-equivalent basis.
Four selected 2025 trench intervals and one later auger interval show what entered solution under the same mild diagnostic method. Representative extraction, mass balance and impurity work come next.
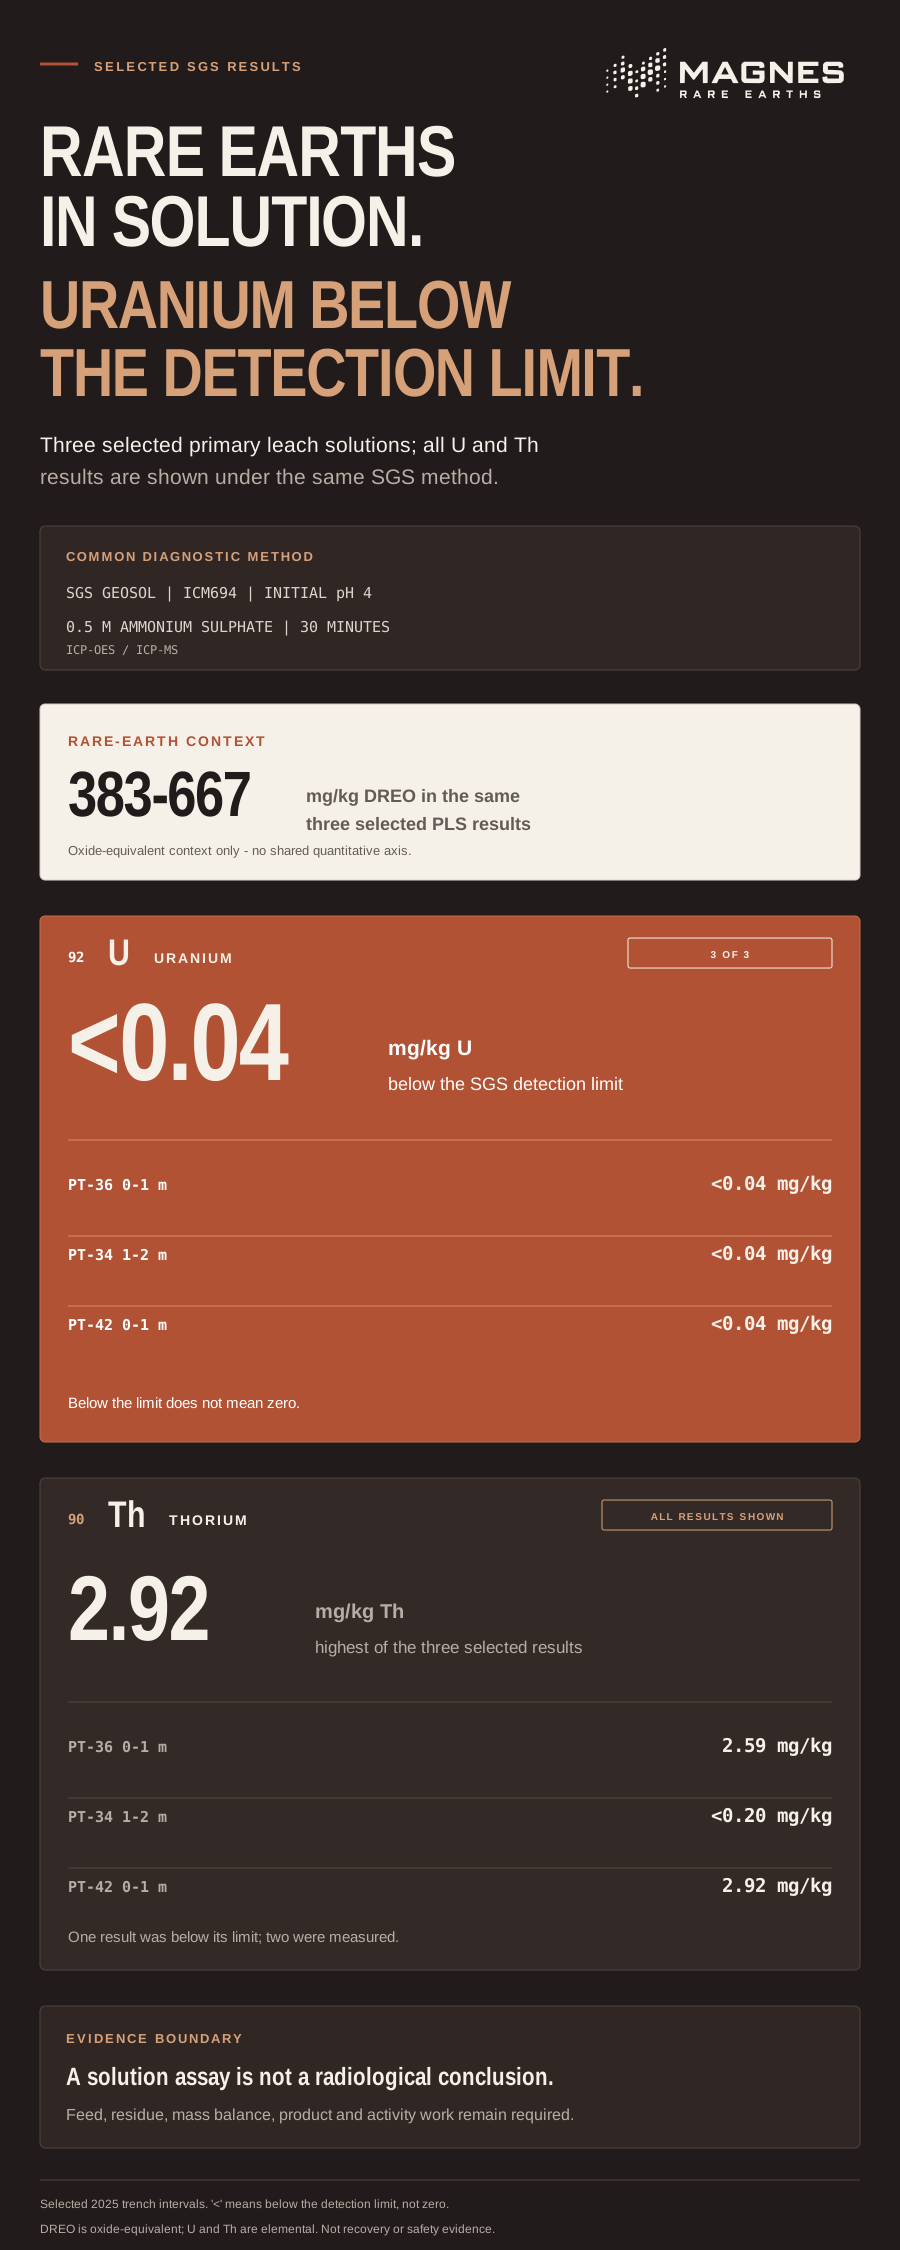
Selected SGS ICM694 primary leach solution results: 0.5 M ammonium sulphate, initial pH 4 and 30 minutes.
| Interval | DREO in PLS | Uranium | Thorium |
|---|---|---|---|
| PT-36 · 0-1 m | 667 mg/kg | <0.04 mg/kg U | 2.59 mg/kg Th |
| PT-34 · 1-2 m | 578 mg/kg | <0.04 mg/kg U | <0.20 mg/kg Th |
| PT-42 · 0-1 m | 383 mg/kg | <0.04 mg/kg U | 2.92 mg/kg Th |
A less-than sign means below the SGS laboratory detection limit, not zero. DREO is oxide-equivalent; U and Th are elemental concentrations. Selected diagnostic solution results, not a resource-average or representative radiological dataset. The concentrations do not characterise uranium or thorium in the feed, residue, water, workplace, potential product or property as a whole and do not establish transfer, recovery, mass balance, total radioactivity, product specification, environmental safety or commercial performance.
Regional execution experience
Cristiano Veloso previously led a mineral business in Minas Gerais through exploration, permitting, financing, mine and plant construction, commissioning and production.
That historical record includes two mines, three plants—two mineral-fertilizer plants and one bioproduction facility—and infrastructure extending to roads, a new bridge and a high-voltage grid connection.
Explore the founder track recordHistorical Verde assets and works do not establish Magnes ownership, access, capital requirements, operating readiness or project economics.
Work programme
Reporting of the SGS bench-scale metallurgical results is the next milestone, following reconciliation and technical review.
No numerical results from the bench programme are disclosed in this release. Commercial recovery and an optimised flowsheet are not established. Timing and outcomes depend on reconciliation, review, required approvals, suitable samples, funding, personnel, permits and other risks; no date is guaranteed.
Map the distribution, drilled geometry and head grade through fieldwork and assays.
Integrate the drilling and supporting datasets without treating exploration footprints as resources.
Measure extraction, selectivity, variability and impurity behaviour with a complete mass balance.
Integrate drilling, geology, metallurgy, engineering and economics into formal studies.
Bring technical results, permits, financing and corporate approval into one capital decision.
Methods and QA/QC
The release identifies SGS Geosol lithium-metaborate fusion followed by ICP-MS (IMS95A) and ICP-OES (ICP95A), with blanks, certified reference materials and duplicates excluded from geological composites. Partial composites cover available contiguous assays, not unassayed gaps.
Carlos Leite, MAusIMM CP(Geo) (No. 1006695), an independent consultant to Magnes Rare Earths, is the Qualified Person identified for technical review under NI 43-101.
Read the technical review in contextCarlos Leite, MAusIMM CP(Geo) (No. 1006695), an independent consultant to Magnes Rare Earths, is the Qualified Person identified for technical review under NI 43-101.
Current stage
The next phase focuses on continuity, recovery, impurities and the route to a potential product.
Follow the project
See the milestones designed to test continuity, recovery and a preliminary development concept.
Magnes investor updates
Receive public company announcements, technical updates and new presentations by email.
Confirm your email to subscribe. Unsubscribe at any time.