
选定钻探区间
MAV_AD_037515 m自地表
1.15%TREO
2,830 ppm MREO · 2026年9月8日Current October update · English technical context
The combined assay compilation covers 879 holes and 7,468.8 assayed metres at the 25 September 2026 cutoff. It includes prior results and complete or partial assay coverage; it is not all-new drilling or gross physical drilling.
MAV_RC_0063 returned 30 metres from surface at 1,853 ppm MREO. Selected cumulative auger profiles include 8 metres at 2,194 ppm MREO in MAV_AD_0691 and 11 metres at 2,179 ppm MREO in MAV_AD_0639.
Reporting of the SGS bench-scale results is the next milestone, after results reconciliation and technical review. No numerical results from this programme are disclosed here. An optimised flowsheet and commercial recovery have not been established; timing and outcomes are not guaranteed.
Older translated project chapters are retained below as dated context, not as the October update. Updated technical translation is not asserted.
巴西米纳斯吉拉斯州 · 勘探阶段
443个已报告钻孔 · 3,628.8米化验钻探. 2026年9月8日.
Magnes Rare Earths正在推进巴西Minas Americas项目。最新化验新增139个螺旋钻孔及首批7个反循环(RC)钻孔,包括从31米起29米、TREO品位0.58%的区间。

15 m自地表
1.15%TREO
2,830 ppm MREO · 2026年9月8日2026年9月8日
253 孔数据集 · 原矿品位
253 孔数据集 · 原矿品位
15 m · 自地表
勘探阶段。化验值为原矿品位;区间为钻孔长度,真厚度尚未确定。这些结果不构成矿产资源、回收率或项目经济性。
项目+区域背景
查看 Minas Americas 在巴西的位置,以及已公布的勘探点、主要道路和清晰标注的 Verde 区域参照地点。
空间披露记录
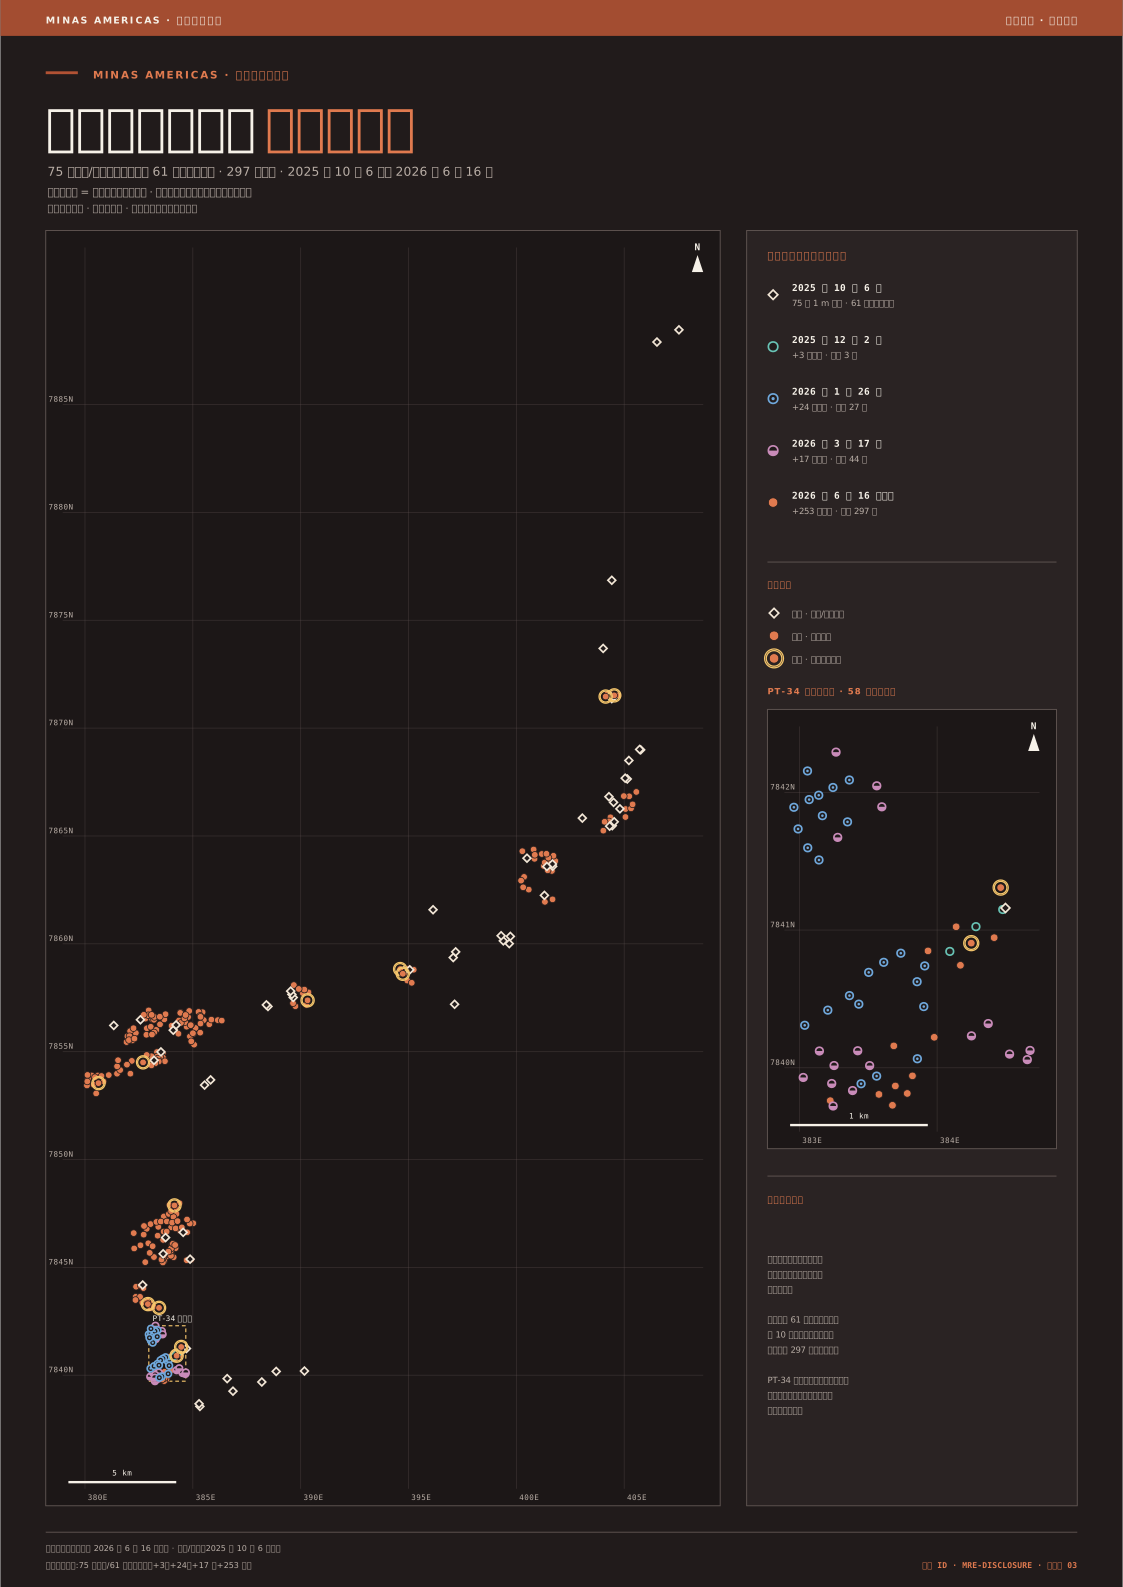
此图为截至2026年6月16日的历史地图。请打开最新交互式地图,查看10月6日公布、分析截止日期为2026年9月25日的汇总:10月的872个不同钻孔加上此前7个RC钻孔,构成已报告的879个钻孔总体。坐标或分析结果与钻孔的对应关系尚未核实的结果明确标为位置未确定;暂缓公开的记录不予显示。
最新地图及结果表采用英文界面。汇总数据与已公布的精选区间保留为不同观测记录,各自注明来源和日期。部分分析区间不会被补算为完整钻孔剖面。
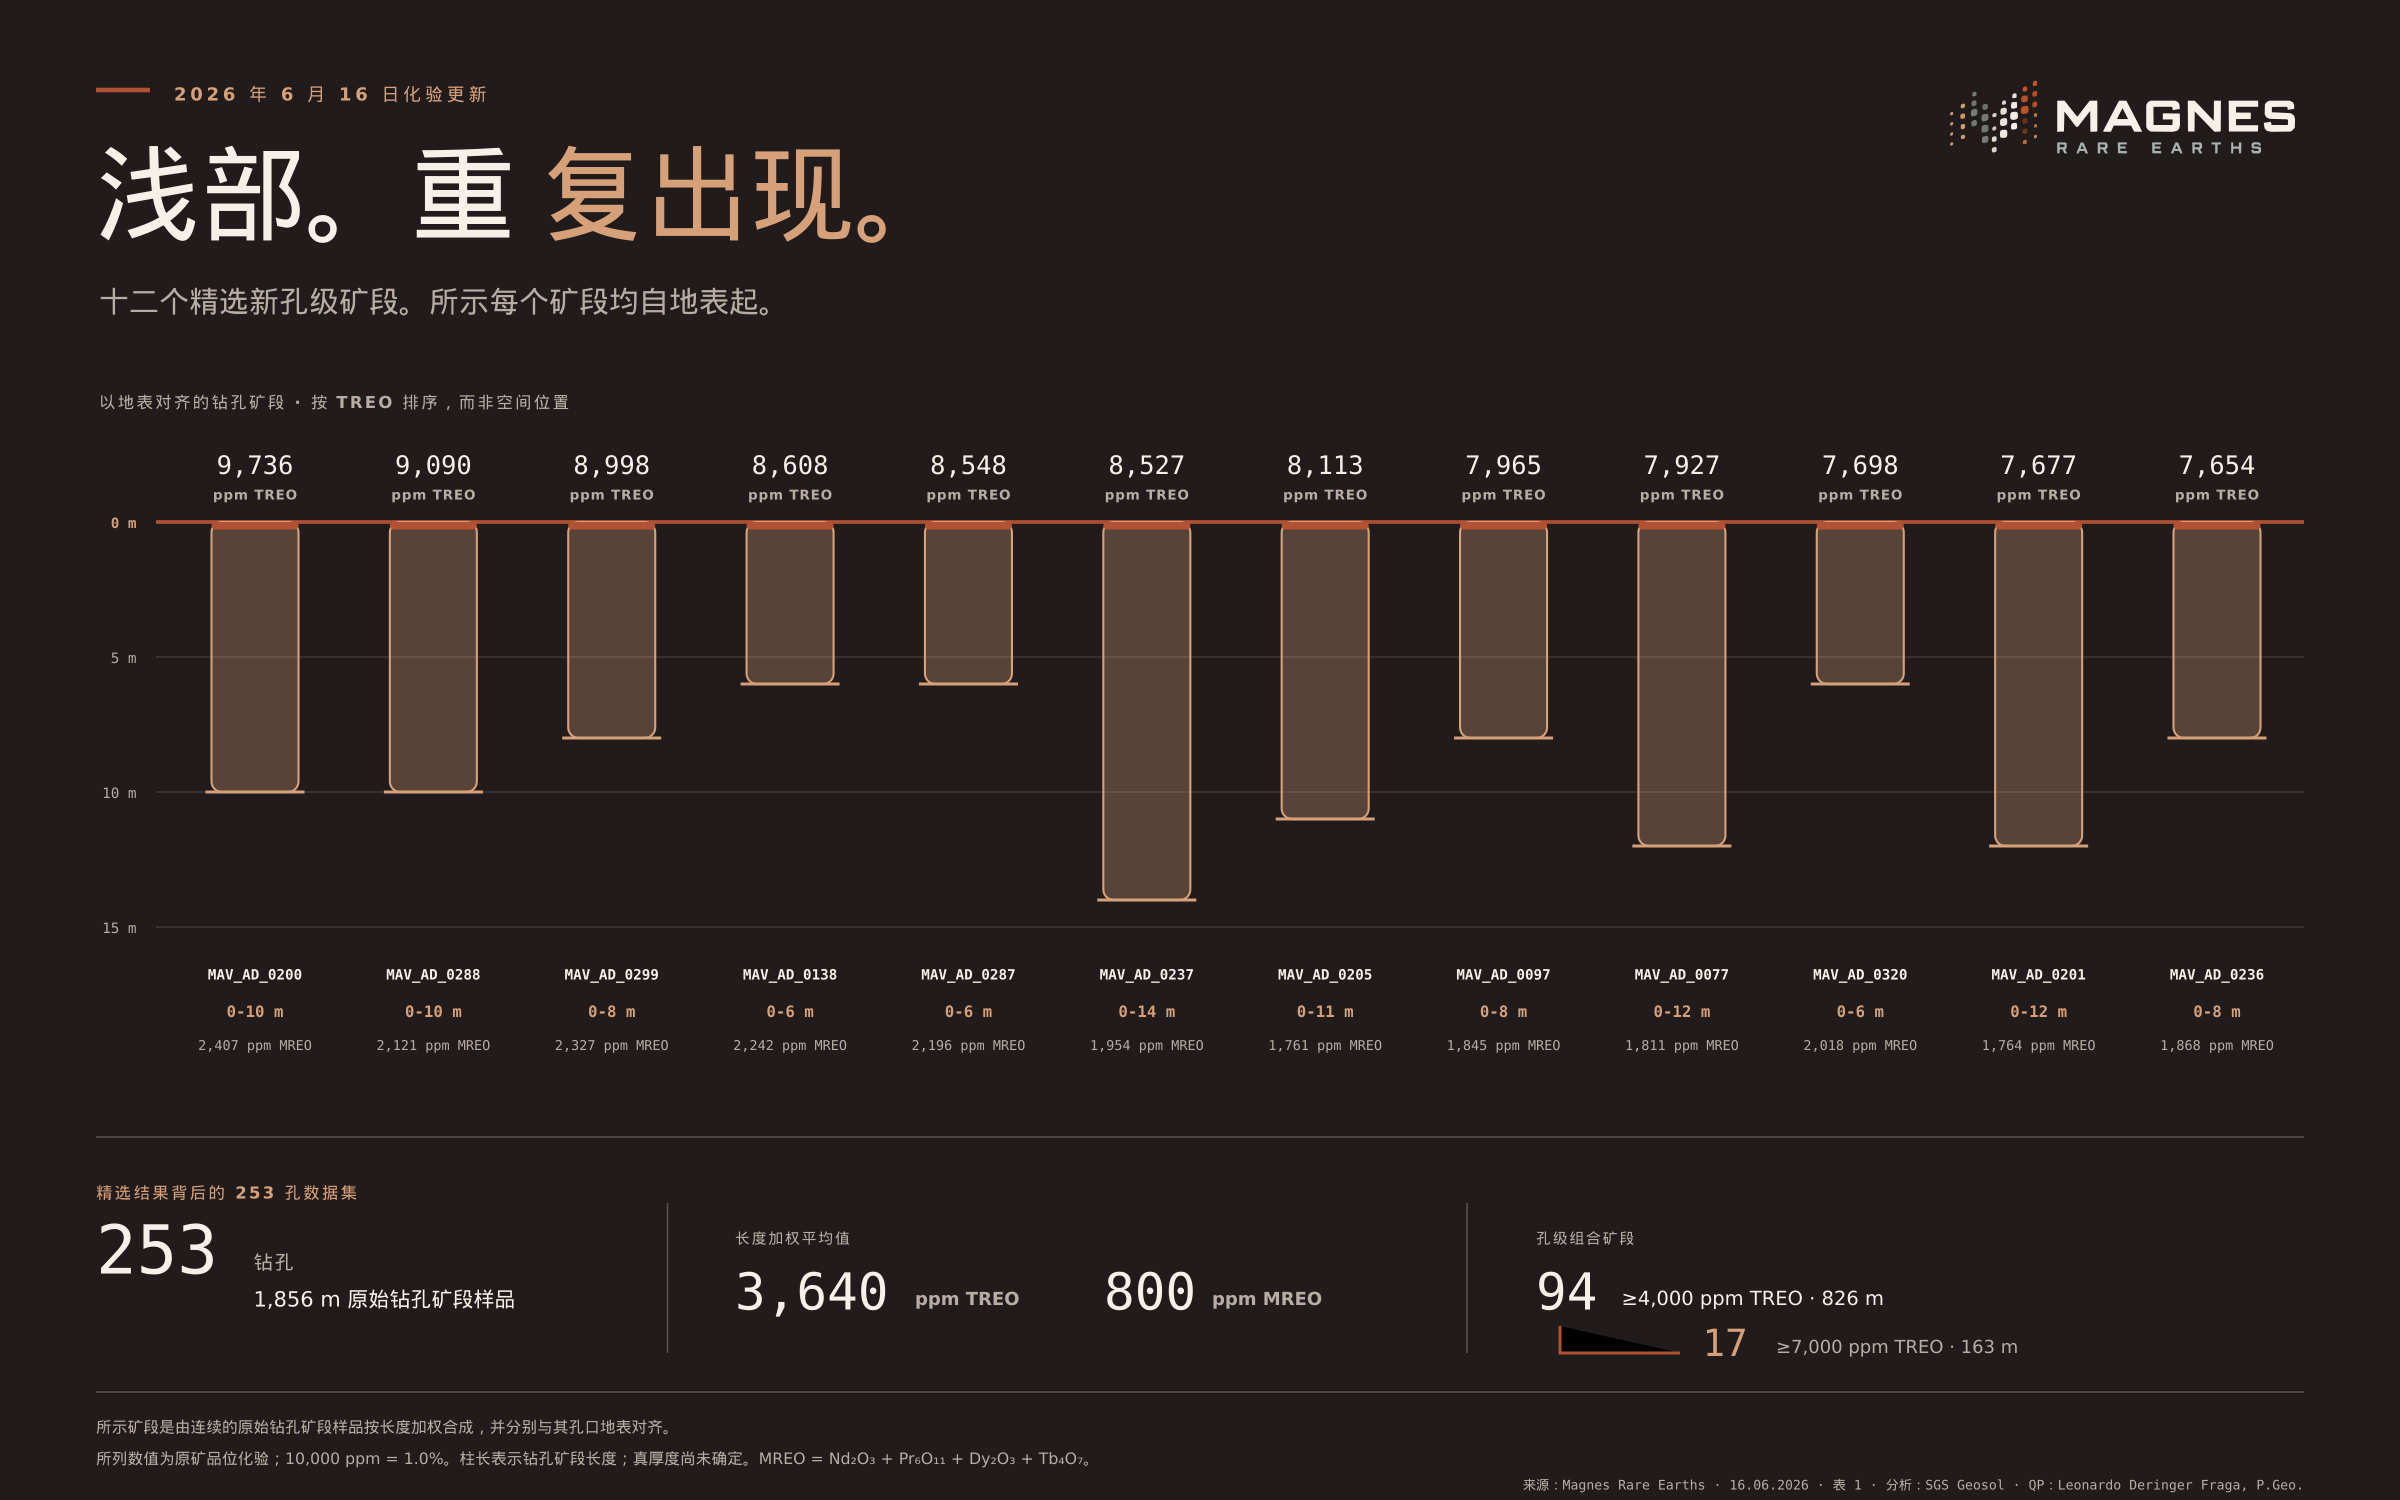
2026 年 6 月 16 日公告表 1 列出 12 个精选新孔级矿段,每个矿段均自地表起,钻孔长度为 6–14 m。 各行仍按 TREO 排序,而非按空间位置排列。
| 钻孔 | 钻孔矿段 | TREO(ppm) | MREO(ppm) |
|---|---|---|---|
| MAV_AD_0200 | 0–10 m | 9,736 | 2,407 |
| MAV_AD_0288 | 0–10 m | 9,090 | 2,121 |
| MAV_AD_0299 | 0–8 m | 8,998 | 2,327 |
| MAV_AD_0138 | 0–6 m | 8,608 | 2,242 |
| MAV_AD_0287 | 0–6 m | 8,548 | 2,196 |
| MAV_AD_0237 | 0–14 m | 8,527 | 1,954 |
| MAV_AD_0205 | 0–11 m | 8,113 | 1,761 |
| MAV_AD_0097 | 0–8 m | 7,965 | 1,845 |
| MAV_AD_0077 | 0–12 m | 7,927 | 1,811 |
| MAV_AD_0320 | 0–6 m | 7,698 | 2,018 |
| MAV_AD_0201 | 0–12 m | 7,677 | 1,764 |
| MAV_AD_0236 | 0–8 m | 7,654 | 1,868 |
在 6 月 253 孔数据集中,披露的长度加权平均值为 3,640 ppm TREO 和 800 ppm MREO。 2026 年 6 月 16 日公告报告了 94 个孔级组合矿段,在 826 m 范围内品位达到或超过 4,000 ppm TREO;其中 17 个在 163 m 范围内达到或超过 7,000 ppm TREO。 所示矿段均为精选原矿品位钻孔长度;真厚度尚未确定。
精选结果为原矿品位钻孔矿段。公告未提供矿产资源量、回收率估算、项目经济性、生产指引或开发决策。
已发布剖面背景
对已发布 A–B 剖面的示意性重绘,其中四个矿段已与化验表核对。
MAV_AD_0012MAV_AD_0013MAV_AD_0002MAV_AD_0001Figure 2 · issued English-source graphic and technical context · 6 October 2026
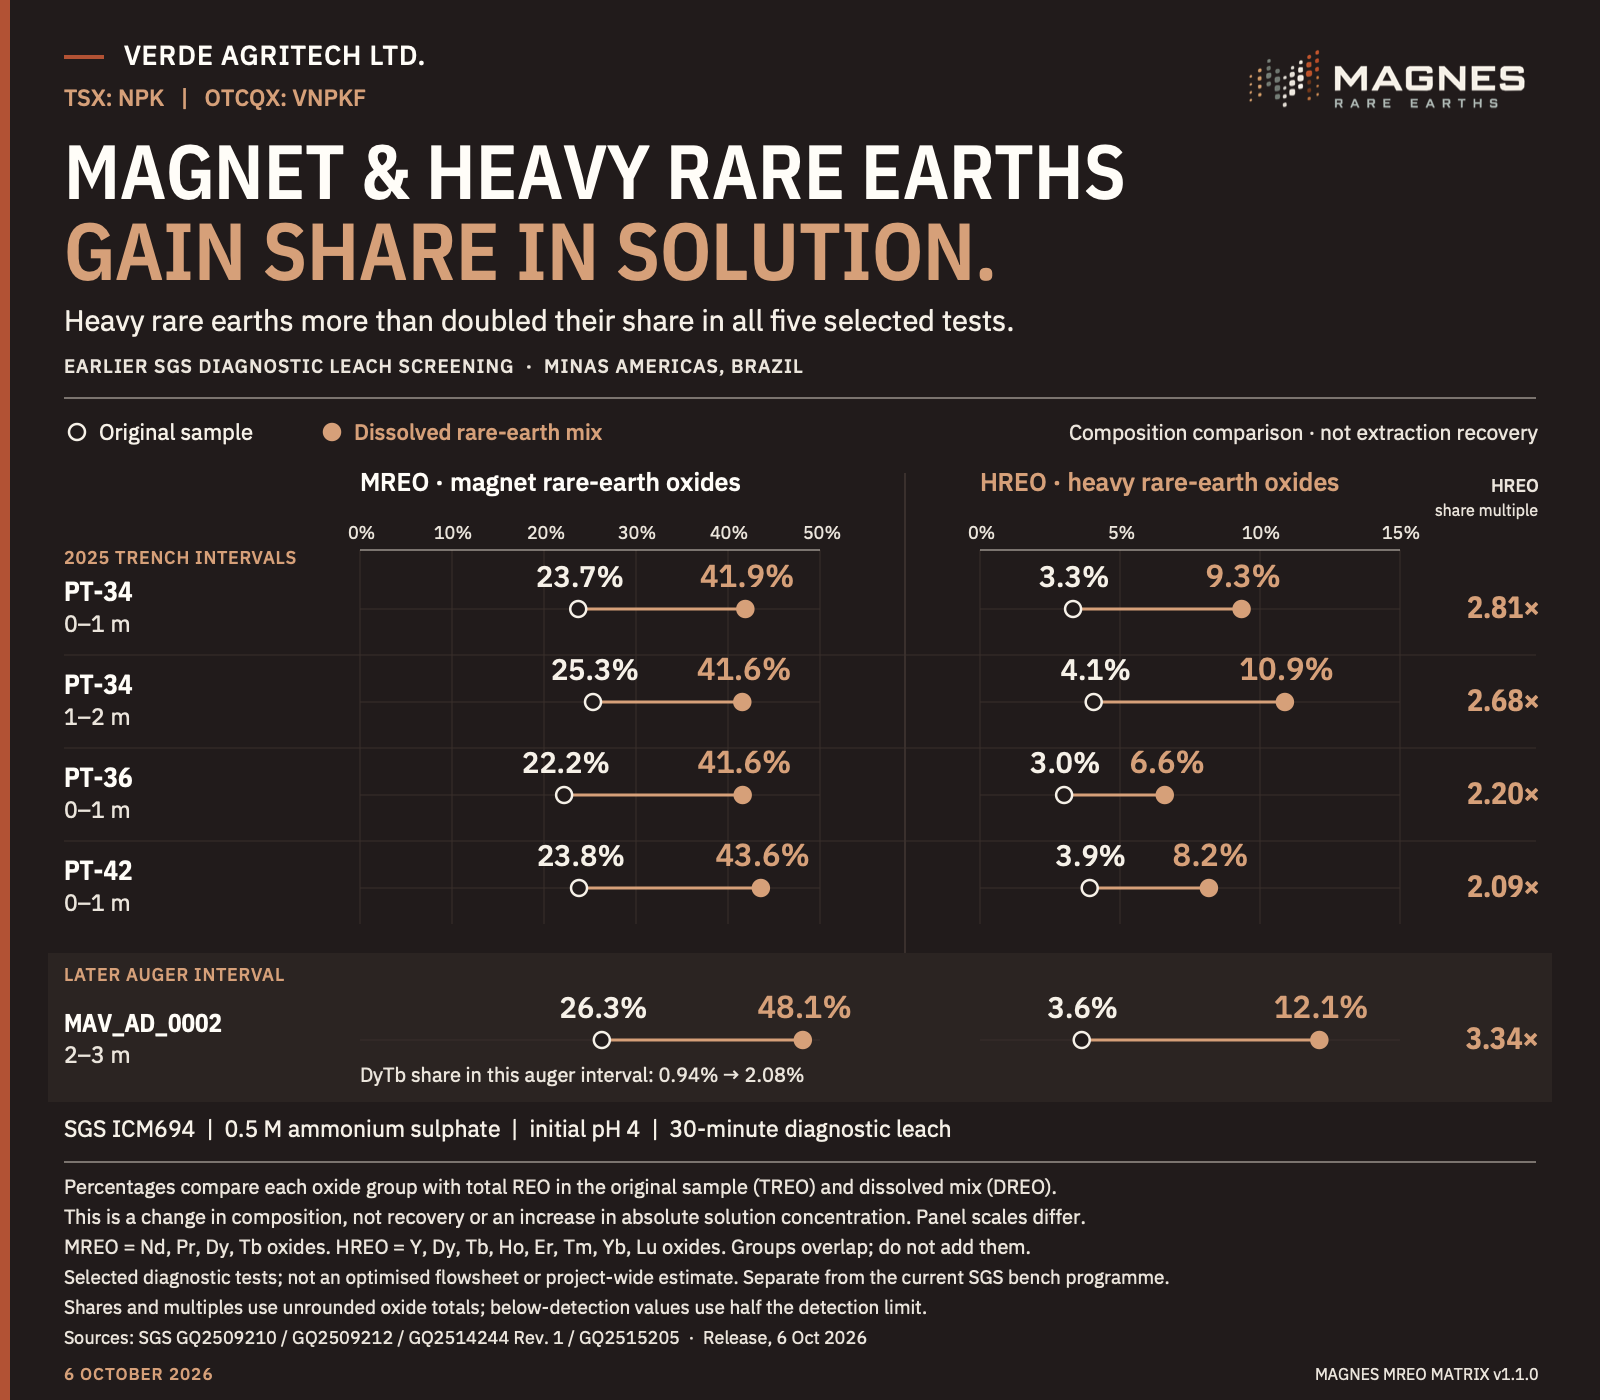
Magnet and heavy rare earths gain share in solution. Figure 2 from the 6 October 2026 release: four selected 2025 trench intervals, plus a later auger interval. HREO represented 6.6–12.1% of the dissolved rare-earth mix, compared with 3.0–4.1% in the original samples.
These are composition shares, not extraction recovery or an increase in absolute solution concentration. MREO and HREO overlap through DyTb and must not be added. Selected diagnostic tests are separate from the current SGS bench programme and do not establish an optimised flowsheet or project-wide recovery.
| Selected interval | MREO · original | MREO · dissolved | HREO · original | HREO · dissolved | HREO share multiple |
|---|---|---|---|---|---|
| PT-34 · 0–1 m | 23.7% | 41.9% | 3.3% | 9.3% | 2.81× |
| PT-34 · 1–2 m | 25.3% | 41.6% | 4.1% | 10.9% | 2.68× |
| PT-36 · 0–1 m | 22.2% | 41.6% | 3.0% | 6.6% | 2.20× |
| PT-42 · 0–1 m | 23.8% | 43.6% | 3.9% | 8.2% | 2.09× |
| MAV_AD_0002 · 2–3 m (later auger) | 26.3% | 48.1% | 3.6% | 12.1% | 3.34× |
Later auger interval DyTb share: 0.94% → 2.08%. Shares and multiples use unrounded oxide totals; below-detection values use half the detection limit. SGS ICM694: 0.5 M ammonium sulphate, initial pH 4, 30 minutes. MREO comprises Nd, Pr, Dy and Tb oxides; HREO comprises Y, Dy, Tb, Ho, Er, Tm, Yb and Lu oxides. The graphic panels use different scales.
These are the five selected historical diagnostic intervals, not the seven geological samples in the separate SGS bench-scale programme. Values describe desorbed oxide equivalents on the laboratory mg/kg reporting basis—not increased absolute solution concentration or recovery.
| Interval | MREO (mg/kg) | DREO (mg/kg) | MREO share of DREO |
|---|---|---|---|
| PT-34 · 0–1 m | 161 | 384 | 41.9% |
| PT-34 · 1–2 m | 240 | 578 | 41.6% |
| PT-36 · 0–1 m | 278 | 667 | 41.6% |
| PT-42 · 0–1 m | 167 | 383 | 43.6% |
| MAV_AD_0002 · 2–3 m | 237 | 492 | 48.1% |
The October source reports PT-34 0–1 m DREO using half detection limits; the reconciled figure is shown above, while the earlier graphic remains unchanged in the dated archive below. MREO and HREO overlap through DyTb and must not be added. Composition is not extraction recovery or commercial process performance.
This is the unchanged earlier illustration, not the October source table or the new SGS bench results. Its original reporting basis must be read in that dated context.
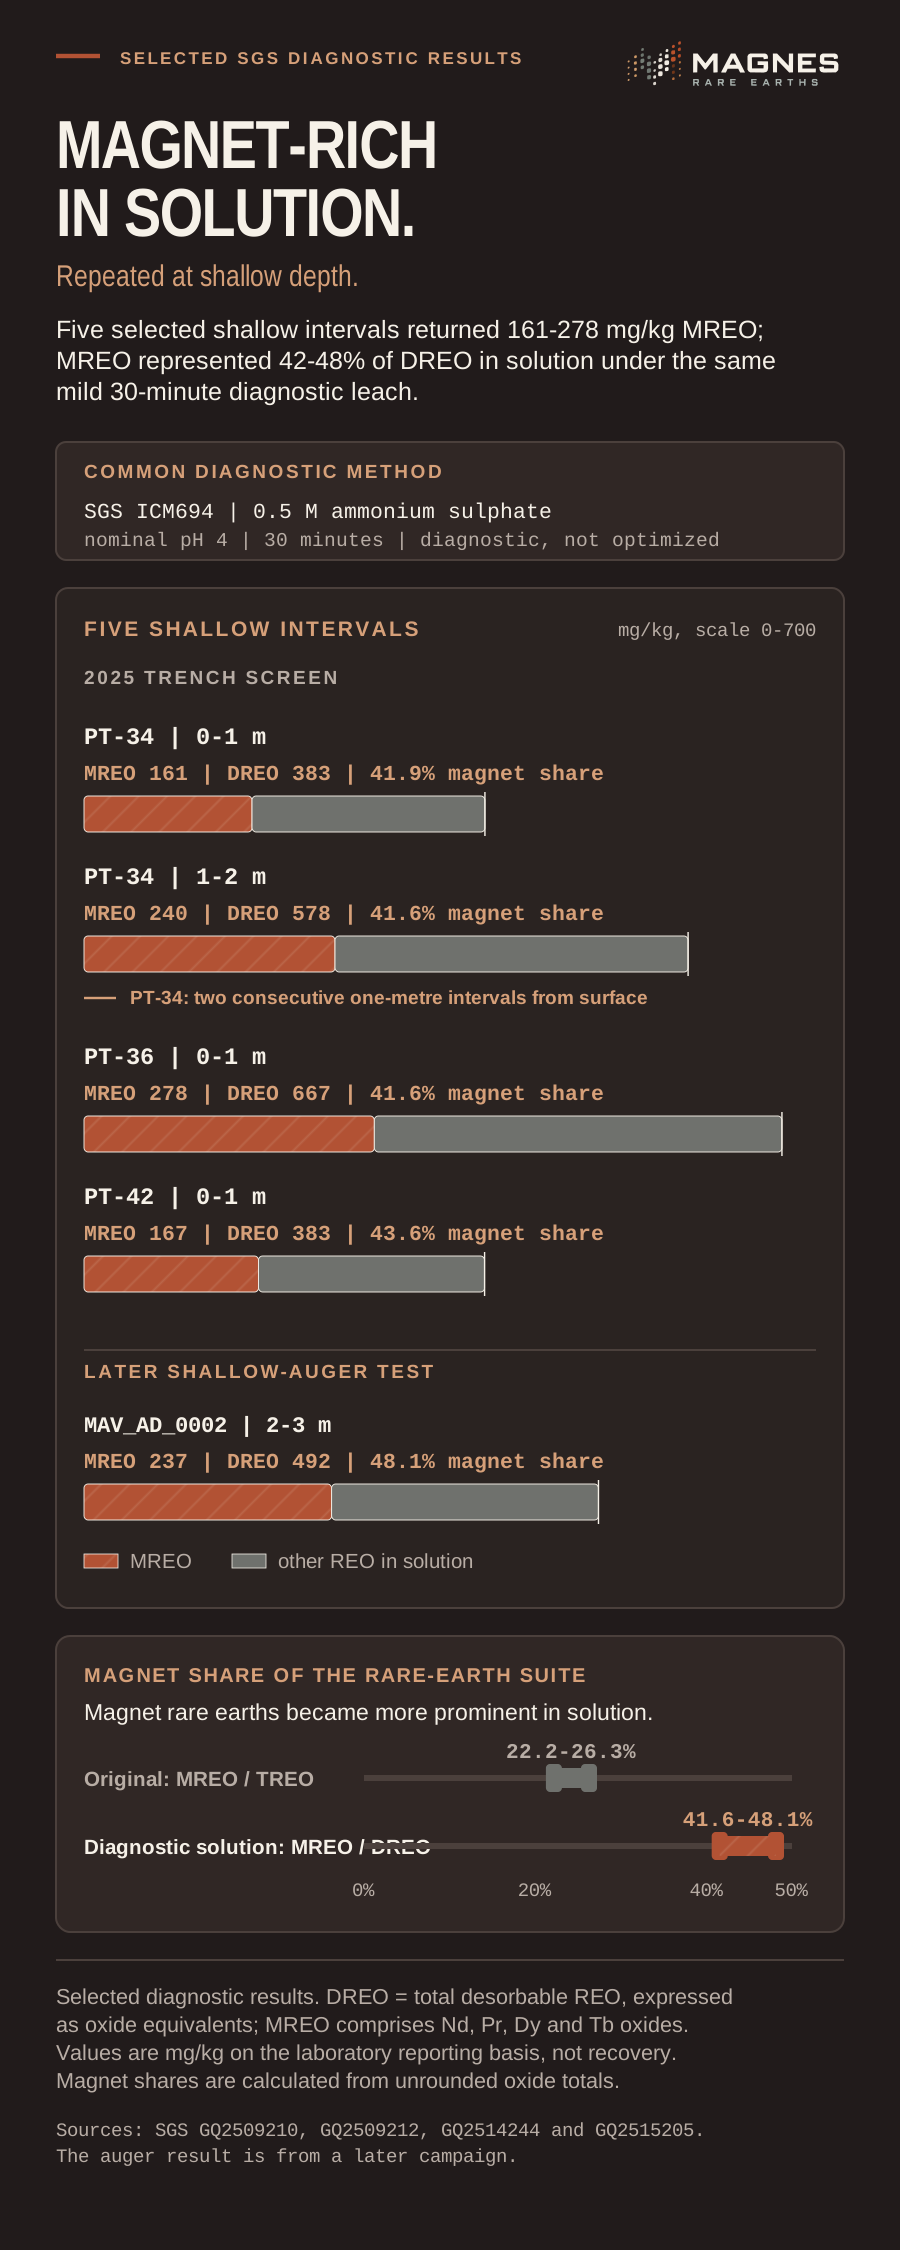
Five selected shallow intervals tested using SGS ICM694: 0.5 M ammonium sulphate, nominal pH 4 and 30 minutes.
| Interval | MREO in solution | DREO in solution | MREO share of DREO |
|---|---|---|---|
| PT-34 · 0-1 m | 161 mg/kg | 383 mg/kg | 41.9% |
| PT-34 · 1-2 m | 240 mg/kg | 578 mg/kg | 41.6% |
| PT-36 · 0-1 m | 278 mg/kg | 667 mg/kg | 41.6% |
| PT-42 · 0-1 m | 167 mg/kg | 383 mg/kg | 43.6% |
| MAV_AD_0002 · 2-3 m | 237 mg/kg | 492 mg/kg | 48.1% |
Selected diagnostic results, not optimised or representative recovery tests. Values are solution concentrations, not recovery percentages. MREO comprises Nd, Pr, Dy and Tb oxides; DREO is expressed on an oxide-equivalent basis.
四个精选 2025 年探槽矿段和一个后续螺旋钻矿段,显示了在同一温和诊断方法下进入溶液的物料。下一步是开展代表性提取、质量平衡和杂质工作。
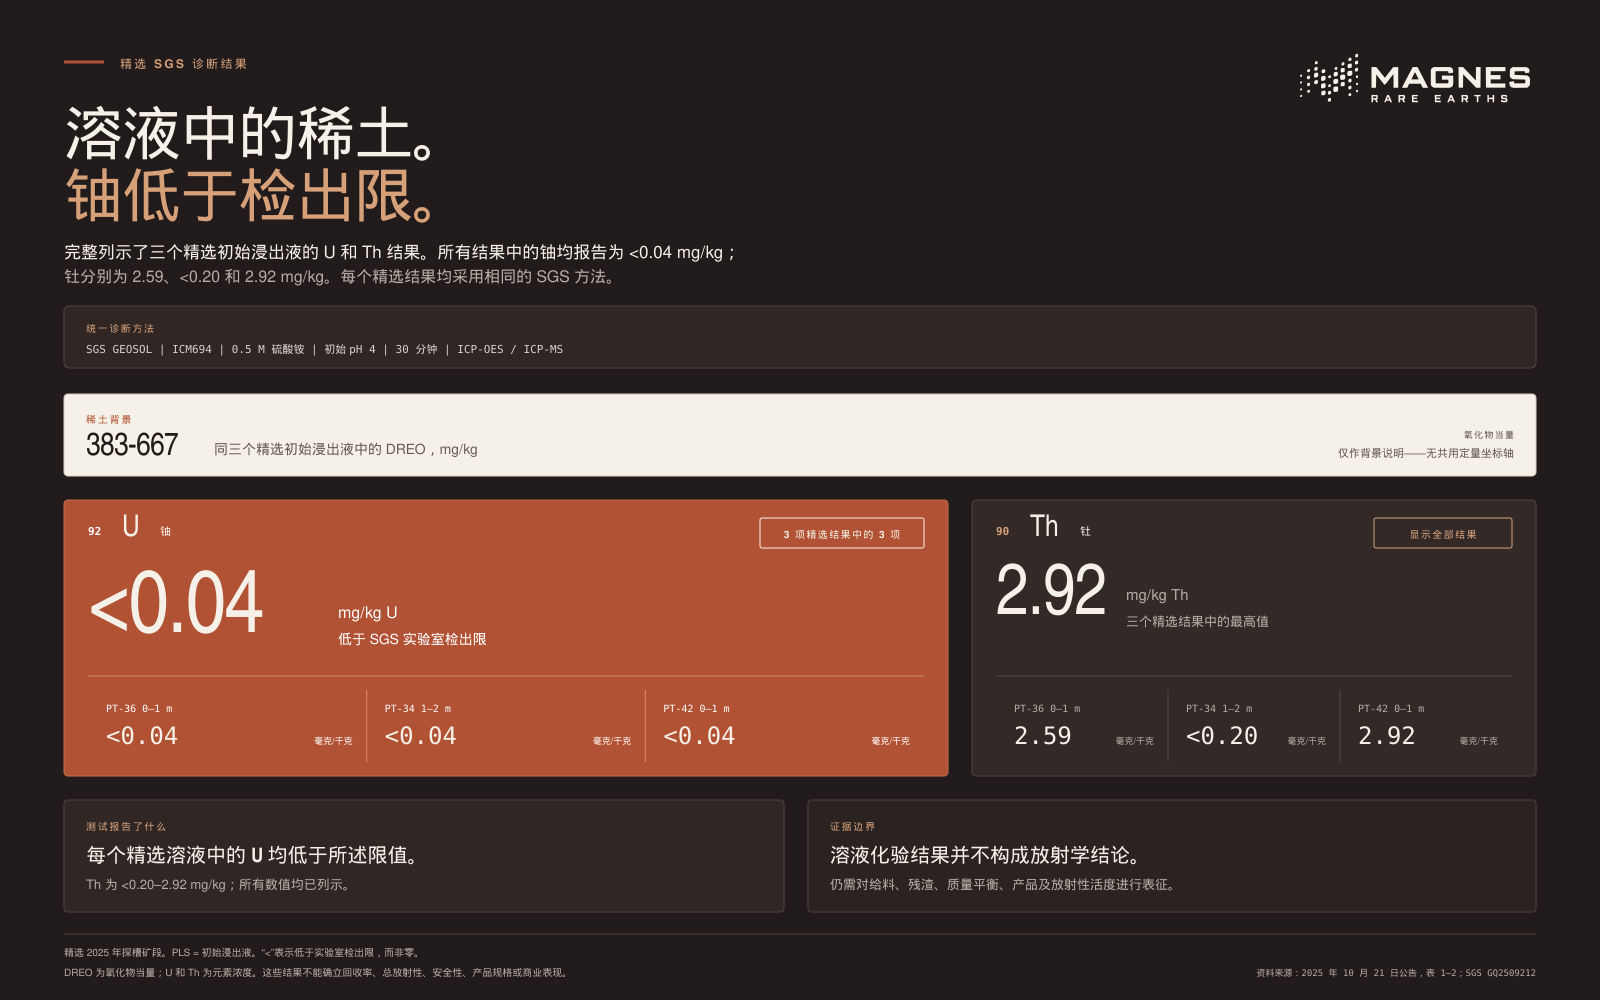
精选 SGS ICM694 初始浸出液结果:0.5 M 硫酸铵、初始 pH 4、30 分钟。
| 矿段 | PLS 中的 DREO | 铀 | 钍 |
|---|---|---|---|
| PT-36 · 0-1 m | 667 mg/kg | <0.04 mg/kg U | 2.59 mg/kg Th |
| PT-34 · 1-2 m | 578 mg/kg | <0.04 mg/kg U | <0.20 mg/kg Th |
| PT-42 · 0-1 m | 383 mg/kg | <0.04 mg/kg U | 2.92 mg/kg Th |
小于号表示低于 SGS 实验室检出限,并不等于零。DREO 以氧化物当量表示;U 和 Th 为元素浓度。 这些是精选诊断性溶液结果,并非资源量平均值或具有代表性的放射性数据集。相关浓度不能表征给料、残渣、水、工作场所、潜在产品或整个矿权范围内的铀或钍,也不能确立转移、回收率、质量平衡、总放射性、产品规格、环境安全性或商业表现。
区域执行经验
Cristiano Veloso 以前在米纳斯吉拉斯州通过勘探、许可、融资、矿场和工厂建设、试运行和生产,领导了一家矿业企业。
这项历史履历包括两座矿山、三座工厂——两座矿物肥料工厂和一座生物生产设施——以及道路、新桥和高压电网连接等基础设施。
了解创始人履历Verde 的历史资产和工程不能证明 Magnes 的所有权、准入权、资本需求、运营就绪度或项目经济性。
工作方案
2026 年 6 月 16 日,Magnes 提出的目标是在 2026 年底前完成矿产资源量估算,并于 2027 年上半年完成 PEA。
通过现场工作和化验,对分布、钻探几何形态和原矿品位进行编图。
整合钻探及辅助数据集,同时避免将勘探覆盖区视作资源量。
在完整质量平衡下测定提取率、选择性、变异性和杂质行为。
将钻探、地质、冶金、工程和经济性纳入正式研究。
将技术结果、许可、融资和公司批准纳入同一项资本决策。
方法与 QA/QC
2026 年 6 月 16 日公告称,位于巴西 Vespasiano 的 SGS Geosol 采用硼酸锂熔融结合 ICP-MS/OES 分析样品,并使用空白样、认证标准物质、现场重复样、实验室复测及实验室重复样实施 QA/QC。
2026 年 6 月 16 日公告中的科学与技术信息经 Leonardo Deringer Fraga, P.Geo. 审查并批准;其为 NI 43-101 所界定的独立合资格人士,EGBC 许可证编号 61611。
结合背景审阅技术审查2026 年 6 月 16 日公告列明了对其技术内容负责的合资格人士。
现阶段
下一阶段的重点是连续性、回收率、杂质和通往潜在产品的路线。