

What It Costs to Process a Tonne of Ionic-Clay Ore
Inside the operating-cost estimates of Brazilian rare-earth projects, with international context
MAGNES RARE EARTHS | RESEARCH & INSIGHTS
Cost-focused research edition: 22 September 2026. The comparison uses the dated studies identified below, not live supplier quotations or demonstrated commercial operating results.
Scope and important context. This is Magnes-sponsored analysis of third-party public studies, not independent investment research or an estimate of Magnes’s costs. It examines expenditure per tonne and what each cost estimate includes. It does not value ore, reprice a rare-earth basket, compare project margins or forecast investment returns. Cost definitions, process endpoints, study dates and operating assumptions differ. Read the qualifications beside the figures and the complete legal notices at the end.
The headline is not the process
A claim that an ionic-clay project can operate for a particular amount per tonne sounds straightforward. It becomes less straightforward when one estimate includes mining and residue placement, another groups processing with product freight, and a third puts general administration outside its plant-cost line.
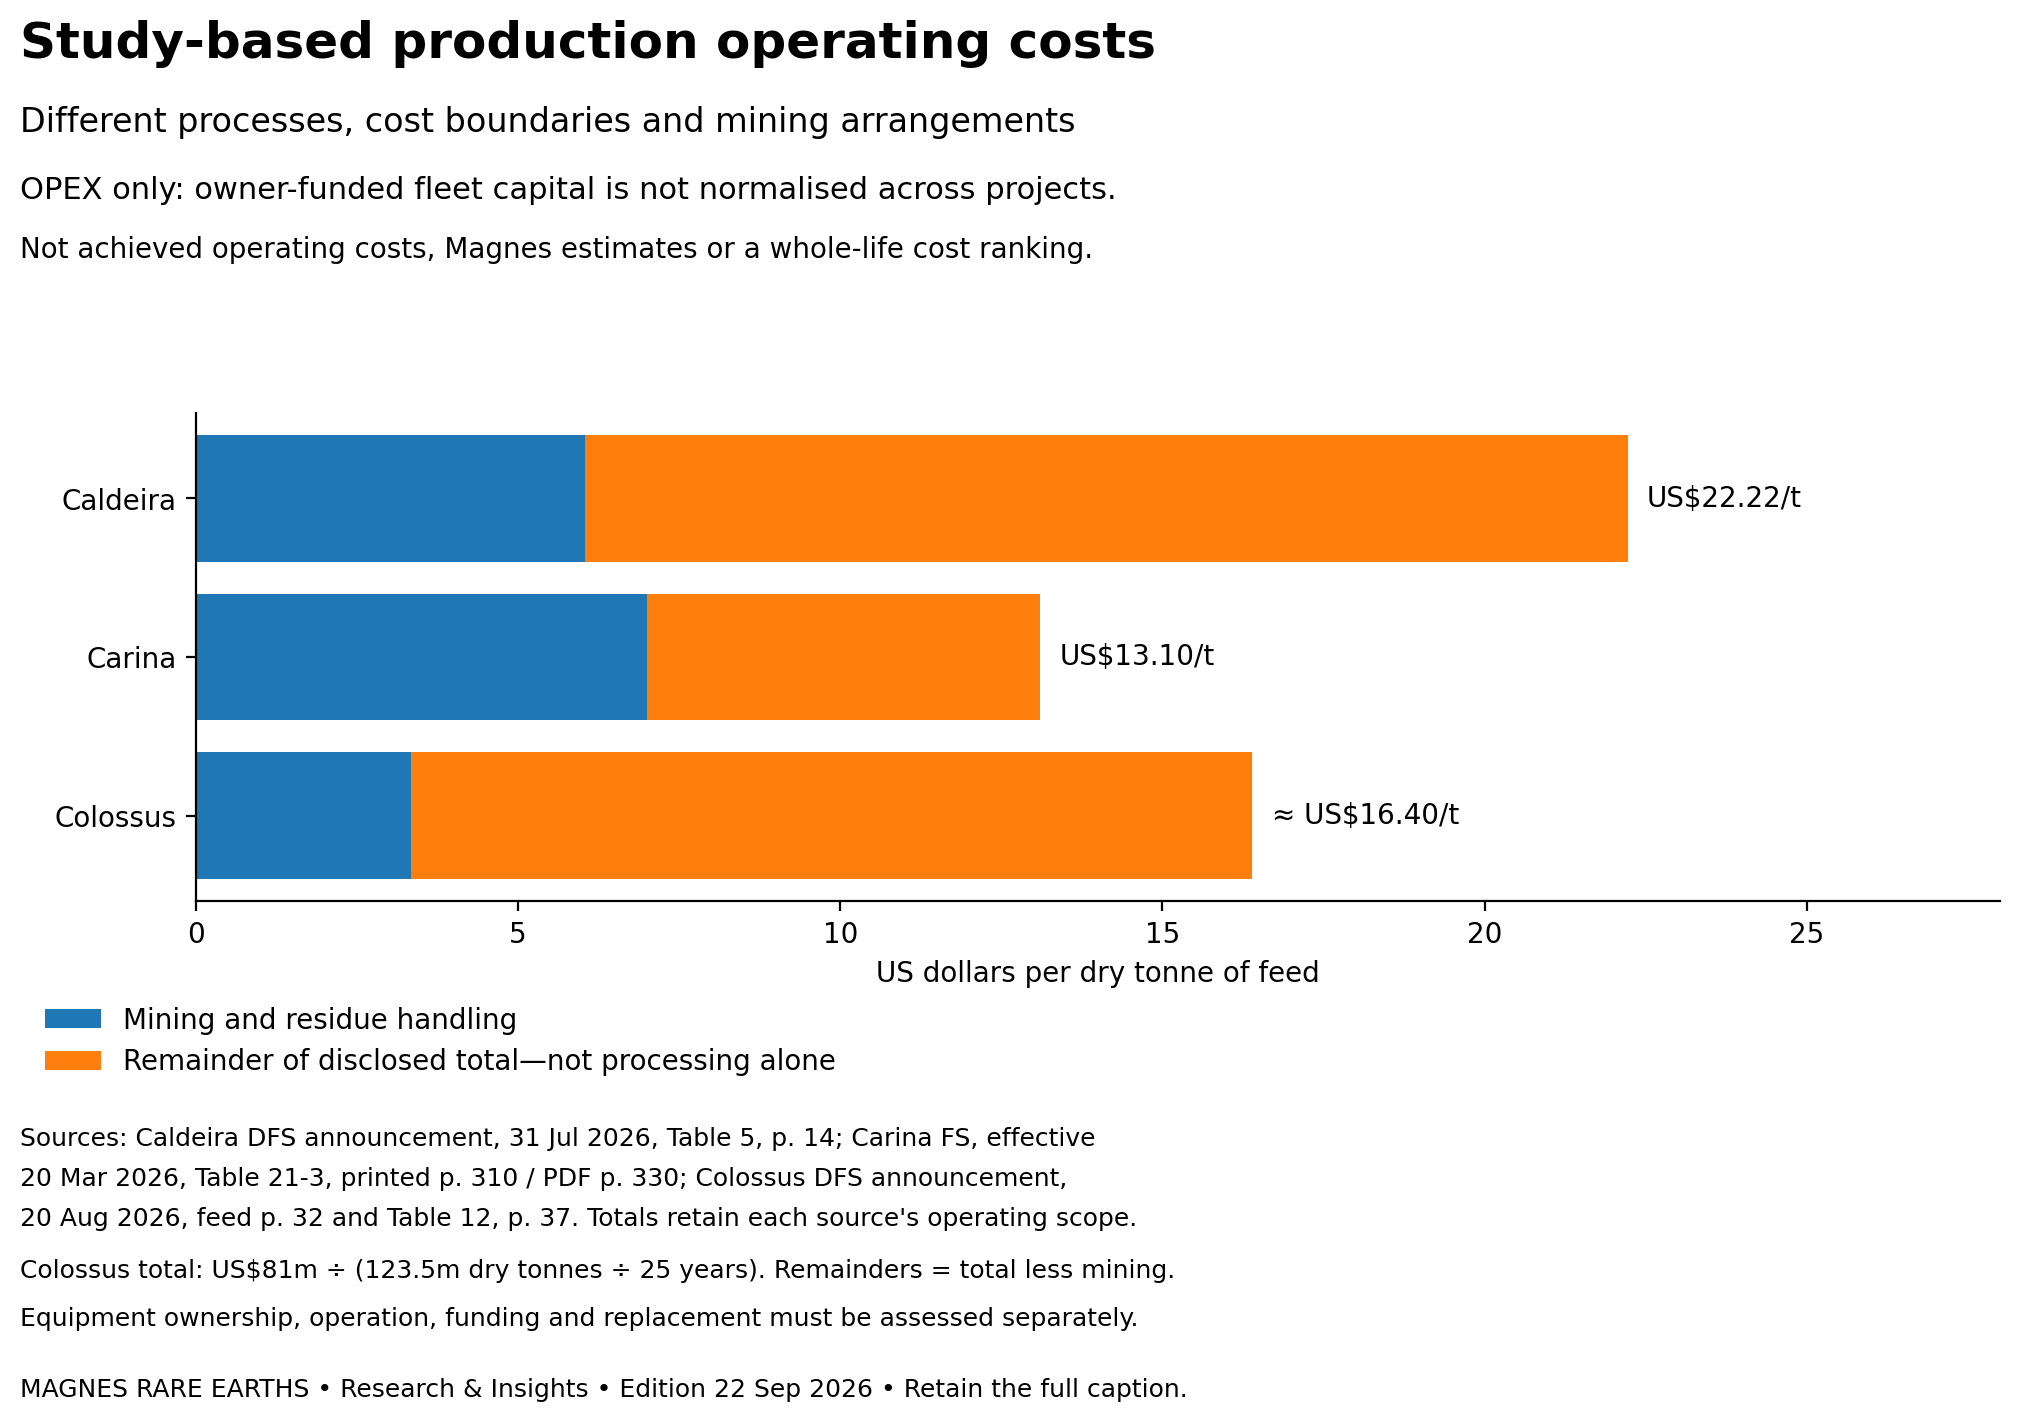
The central Brazilian figures in this review are US$22.22 per dry tonne for Caldeira, US$13.10 for Carina and approximately US$16.40 for Colossus. The first two are reported study figures; the third is calculated from the issuer’s annual expenditure and matched feed schedule. None is the price of an interchangeable, stand-alone leaching service.1, 2, 3
The purpose of this article is to look under those headlines. What is included in mining? Which chemical quantities and prices are modelled? Where are filtration, water treatment, maintenance, laboratory services and administration recorded? Does a low labour line exclude staff charged elsewhere? Is a future replacement treated as an operating expense or sustaining capital?
The distinction between operating expenditure and fleet capital is particularly important. A contractor-supplied fleet can be paid for through the service rate; an owner-purchased fleet can place acquisition and replacement cash flows outside the quoted cash operating cost. Neither arrangement makes equipment free, and neither is automatically the lower-total-cost solution.4
These questions can be answered in useful detail without assigning a selling value to the ore. A lower cost is not, by itself, evidence of a better investment. That is a limitation of a cost-only study, not a reason to avoid examining costs carefully.
1. Define the tonne and the cost boundary
Here, production OPEX means the source’s disclosed operating expenditure for its specified mine-to-product system. Processing-plant OPEX is the narrower expenditure assigned to the plant. The two are not synonyms. We preserve C1 where an issuer uses that term, without assuming it has an identical definition across studies. AISC, or all-in sustaining cost, is retained only as a separate source-defined measure where needed to explain costs outside C1.
A dry tonne of plant feed is also not automatically a wet tonne mined, a tonne of waste moved, or a tonne entering an individual leach unit after screening. For the Brazilian core, the denominator is the disclosed dry ROM or plant-feed schedule, not an invented post-beneficiation mass. MREC means mixed rare-earth carbonate: an intermediate containing rare earths, not a set of separated individual oxides.
The calculation used for a period-based comparison is:
Operating expenditure per dry tonne = expenditure over the defined period ÷ dry feed over the same period.
That identity does not authorise mixing a nameplate annual rate with life-of-mine average expenditure. Nor does putting all rows into US dollars remove differences in local wages, reagent sourcing, electricity tariffs, taxes, currencies or estimate dates.
The main comparison: same unit, still different scope
| Project and study | Feed-rate context | Production OPEX, US$/dry tonne | What the total covers |
|---|---|---|---|
| Caldeira — Meteoric; DFS, 31 July 2026 | Initial plant rate 6.0 million dry t/year; the life-of-mine schedule is a separate basis | 22.22 — reported | Mining and spent-clay handling; the plant-cost framework including site administration; disclosed product transport.5, 6 |
| Carina — Aclara; FS effective 20 March 2026 | 9.713 million dry t/year in the plant-cost table’s nominal standard year | 13.10 — reported | Mining and washed-clay deposition; hydrometallurgy; G&A, environmental/social programmes and logistics. Further separation is outside this total.7, 8 |
| Colossus — Viridis; DFS, 20 August 2026 | 5.0 million dry t/year nominal; 4.94 million average over the evaluated schedule | 16.40 — derived | Mining/residue handling; processing and transport, including the disclosed carbonate-refining flowsheet; separate G&A.9, 10 |
The Carina capacity is a dry-feed quantity; a larger wet-material figure is not extra dry-processing capacity. Caldeira’s initial rate must not replace its complete scheduled tonnage. Colossus’s denominator is 123.5 million dry tonnes over 25 years, so its average is 4.94 million dry tonnes a year, and US$81 million ÷ 4.94 million = approximately US$16.40/t.11, 12, 13
Fleet-cost caution. The comparison preserves each study’s allocation between operating expenditure and capital. Caldeira uses an owner-mining estimate; Colossus models initial contract mining followed by owner operation; Carina describes contractor mining operations with Aclara supervision. Those descriptions do not establish identical fleet funding or replacement boundaries. The detailed ownership comparison below explains what can and cannot be normalised.14, 15, 16
The narrower plant comparison needs another qualification
| Project | Plant-related amount, US$/dry tonne | Exact interpretation |
|---|---|---|
| Caldeira | 14.65 — sum of listed lines | Labour, maintenance, general expenses, power, and reagents/operating consumables, excluding the separately listed mining and product-transport lines. Site G&A sits within the broader plant framework.17 |
| Carina | 4.30 consolidated; 4.31 detailed | Source hydrometallurgical estimate. Mining and the separate G&A/ESG/logistics budget are outside this plant line. The detailed and consolidated schedules are not silently substituted for one another.18, 19 |
| Colossus | 12.29 — derived | The combined processing and transportation line. The disclosure does not establish a separate plant-only cost that can be compared directly with Carina’s hydrometallurgical subtotal.20 |
It would be wrong to call these three numbers the cost of the same processing service. They are useful because they identify where the estimates differ and which missing allocations would be needed to make a narrower comparison.
2. Caldeira: chemicals, material handling and a changing plant design
The disclosed operating-cost schedule
Caldeira’s DFS-results announcement and attached engineering executive summary provide a comparatively detailed breakdown; they are not the complete underlying engineering model. The source states that the cost inputs were obtained in, or escalated to, the first quarter of 2026. Its mine-cost line includes returning spent clay to mined-out pits or designated placement areas; site G&A is incorporated in the broader process-plant framework.22
| Cost centre | Reported US$ million/year | Reported US$/dry tonne |
|---|---|---|
| Mining and spent-clay handling | 39.66 | 6.04 |
| Plant labour — source fixed-cost group | 12.01 | 1.83 |
| Maintenance — source fixed-cost group | 8.06 | 1.23 |
| General expenses — source fixed-cost group | 7.56 | 1.15 |
| Power | 8.37 | 1.27 |
| Reagents and operating consumables | 60.20 | 9.17 |
| Product transport — source label “CIF Santos Brazil” | 10.13 | 1.54 |
| Published total C1 | 145.98 | 22.22 |
The displayed tonne-based components add to US$22.23/t, while the published total is US$22.22/t. We retain the reported total and disclose the rounding-level non-closure. Similarly, the US$14.65/t plant-related sum in Table 2 is not a newly reported subtotal: subtracting rounded mining and freight from the rounded total instead gives US$14.64/t.24
The transport label is reproduced as written. It does not, on its own, establish delivery to an overseas separation plant. The executive summary separately discusses ROM-pad operations, grade control, ore haulage and spent-clay rehandling within its cost build-up. Their allocation should be traced before adding them to another line; the public summary does not justify charging the same movement twice.25
The mine estimate is explicitly based on owner mining. This identifies its estimating strategy, not a claim that every cash cost of equipment ownership sits in the quoted mining OPEX. Acquisition, financing, hire, maintenance and replacement treatment must be reconciled to the source schedules before comparing it with a contractor-supplied fleet rate.26, 27
Why initial capacity gives the wrong denominator
Caldeira’s financial summary evaluates 23 years and its production schedule contains 151.071 million dry tonnes, implying approximately 6.568 million dry tonnes per year over that schedule. That is not the same as its initial 6.0 million-tonne design rate. Dividing the reported US$145.98 million annual cost by the initial rate would give US$24.33/t, not the disclosed life-of-mine tonne-cost basis.28
This is an averaging issue, not evidence that the disclosed C1 total is wrong. The appropriate comparison preserves the staged schedule and its matching expenditure. It does not infer a new expansion design merely from the average.
What drives the chemical and consumables bill
The engineering executive summary says reagent consumption is derived from the mass balance, with prices for delivery to site, and identifies ammonium bicarbonate as the largest contributor to its reagent/consumable category. Pilot work informed consumption estimates for important inputs such as flocculant. Those statements establish an estimate basis; the public summary does not supply an equivalent of Carina’s complete itemised purchasing table.29
The flowsheet also changed. Further work showed that the coarse fraction could not simply be treated as barren, prompting whole-feed treatment and additional sizing, grinding and screening. The executive summary describes a more complex water-recovery system as well. These changes carry equipment, wear, power, chemical and maintenance consequences; a comparison that assumes an unchanged leach circuit would miss them.30
The relevant cost question is not simply how much ammonium sulfate enters the circuit. It is the complete purchasing requirement: leachant replacement, pH control, impurity removal, precipitation, flocculation, water treatment and consumables, including losses associated with the solids and liquid streams.
An actual optimisation, and costs that rose elsewhere
Caldeira’s executive summary reports that flocculant selection following testwork reduced annual base-case spending from US$16.5 million to US$6.9 million. The difference is US$9.6 million per year, equivalent to US$1.60/t at the specified 6 million-tonne base-case rate. This saving is already inside the DFS comparison; it must not be deducted again from the reported C1 figure.31
The same source reports reagent quotation increases of 25% for ammonium bicarbonate, 68% for ammonium sulfate and 7% for sulfuric acid. Quoted power rose from 6.0 to 7.1 US cents/kWh. These are source-reported changes between estimate stages, not contemporary purchase quotations.32
General expenses also changed materially in that base-case discussion, from US$6.26 million to US$14.80 million, principally because contract laboratory services and operating insurance were better defined. The source incorporates a prospective US$1.45 million annual laboratory saving from year 3. These base-case figures are not the same basis as the life-of-mine general-expense line of US$7.56 million/year in Table 3; the public text does not provide a complete numerical reconciliation between them.33, 34
The lesson is specific: a process saving can be genuine while the total estimate rises because purchasing rates, scope, outsourced services or operating assumptions change. Study maturity does not guarantee that every line rises, or that the total falls.
3. Carina: a small plant-cost line within a much larger operating system
Start with the complete production budget
Carina’s full feasibility report separates mining, hydrometallurgy and site support. That structure is essential: the low plant line cannot substitute for the complete mine-to-carbonate estimate.
| Cost centre | Reported life-of-mine US$ million | Reported US$/dry tonne |
|---|---|---|
| Mining and washed-clay deposition | 1,196.7 | 7.00 |
| Hydrometallurgical facility | 738.6 | 4.30 |
| G&A, ESG and logistics | 299.1 | 1.80 |
| Total production OPEX | 2,234.4 | 13.10 |
The mining estimate covers equipment operation and support, rock removal, maintenance, labour, mobilisation/demobilisation and fuel. It uses vendor quotations together with assumed equipment productivity, hours and efficiencies. The source attributes the lower early-year mine cost to shorter haul distances and a lower stripping ratio—not simply to the size of the processing plant.36
The workforce section describes contractor mining operations under Aclara’s own mine supervision. That is evidence of an operating arrangement, not a complete statement of who buys, leases or replaces each machine. This article therefore does not infer a fully contractor-financed fleet from the personnel tables or calculate a contractor premium for Carina.37
Table 21-4 separates US$161.2 million of mine diesel from US$1,035.6 million of other mine expenditure over the mine life, using a diesel assumption of US$1.09/litre. Diesel is therefore already within the consolidated mining cost; it is not an extra plant expense to add on top of the complete mining line.38
Inside the hydrometallurgical estimate
| Plant cost centre | Reported life-of-mine US$ million | Reported US$/tonne of dry feed |
|---|---|---|
| Reagents | 232.6 | 1.36 |
| Electrical energy | 214.0 | 1.25 |
| Maintenance supplies | 106.8 | 0.63 |
| Labour | 64.2 | 0.38 |
| Other services | 42.6 | 0.25 |
| Product packing material | 30.3 | 0.18 |
| Laboratory analysis | 18.9 | 0.11 |
| Filtering maintenance services | 15.4 | 0.09 |
| Filtering cloths | 10.7 | 0.06 |
| Diesel | 1.5 | 0.01 |
| Potable water | 0.1 | 0.00, rounded |
| Published detailed plant total | 737.1 | 4.31 |
The detailed US$737.1 million total and consolidated US$738.6 million line differ. Also, displayed component unit costs do not sum exactly to the printed unit total. Neither table is silently “corrected” by manufacturing an additional line.40
The plant-estimate qualifications are substantive. Reagents, consumables and utilities exclude taxes and duties; long-term escalation is not included; and the plant OPEX estimate contains no contingency/miscellaneous allowance. These statements concern the plant-estimating boundary. They do not establish that Carina’s complete cash-flow model ignores tax or that the project has no capital contingency.41
Modelled reagent consumption is not an independently measured make-up balance
The next table shows selected reagents for which the published consumption and unit-price assumptions allow an explicit cost-model normalisation. The source labels these quantities as consumption; this review does not independently establish their equivalence to measured fresh purchases or steady-state net make-up. The denominator is the source’s nominal 9.713 million dry tonnes per year, not its life-of-mine average. Delivered specifications and the scope of each quotation still matter.42
| Reagent — source terminology | Source tonnes/year | Source price, US$/tonne | Derived modelled kg/dry tonne feed | Derived modelled US$/dry tonne feed |
|---|---|---|---|---|
| Ammonium bicarbonate | 7,630 | 684 | 0.786 | 0.537 |
| “Anhydrous ammonium” | 3,337 | 1,043 | 0.344 | 0.358 |
| Sulfuric acid, 98% | 9,362 | 344 | 0.964 | 0.332 |
| Flocculant | 98 | 3,882 | 0.010 | 0.039 |
| Ammonium sulfate | 464 | 544 | 0.048 | 0.026 |
| Quick lime | 722 | 217 | 0.074 | 0.016 |
| Soda ash | 532 | 280 | 0.055 | 0.015 |
| Green sand | 55 | 1,153 | 0.006 | 0.007 |
| Potassium permanganate | 68 | 731 | 0.007 | 0.005 |
These selected nominal-year cost-model quantities are not a reconstructed replacement for the life-of-mine US$1.36/t reagent total, or independent evidence of achieved fresh make-up consumption. Different averaging bases and the excluded rows must remain visible. “Anhydrous ammonium” is the source wording; it is not silently converted into an assumed chemical specification.44
The source also lists ion-exchange resin and a water-treatment reagent, but the printed annual volumes, unit prices and life-of-mine values do not reconcile sufficiently to infer reliable replacement volumes. Their reported costs remain in the source total. We exclude those quantities from Table 6 rather than treating their cost as zero or guessing a missing multiplier.45
A low modelled ammonium-sulfate consumption line does not establish low total chemical use or independently demonstrate the circuit’s net reagent replacement requirement. Other ammonium-bearing inputs, acid, impurity-removal reagents, water-treatment chemicals and precipitant purchases still have to be paid for. The design combines precipitation, ion exchange, nanofiltration and reverse osmosis; that integrated circuit, rather than an isolated leach test, is the relevant operating system.46
Electricity and maintenance are the cost of keeping the circuit working
Carina’s electricity schedule allocates expenditure among ore extraction, solid–liquid separation, filtration, water treatment, reagent systems, compressed air and other services. The disclosed design load totals 28.1 MW. This is a load figure, not annual energy consumption; converting it to kWh per tonne requires operating hours and load assumptions on a compatible basis.47
Maintenance is not described merely as a wage bill. The source estimates material spares and changeouts as percentages of mechanical-equipment supply cost, using 2% for the general basis and 5% for plant areas subject to erosive and corrosive conditions. Contract crewing for the annual maintenance shutdown is explicitly excluded from that estimate. Its eventual cost cannot be quantified from the disclosed exclusion alone.48
The same paragraph states that maintenance costs are assumed to cover sustaining CAPEX. Elsewhere the report separately identifies US$56.7 million of sustaining expenditure, including land clearance, roads, infill drilling and pit drainage, and US$74.6 million of closure cost. These are different described scopes, not automatic proof of double counting. A proper reconciliation must identify which plant replacements sit in maintenance and which mine or infrastructure works sit in the sustaining schedule; neither zero sustaining capital nor a second blanket plant-replacement allowance is justified.49, 50
The low plant-labour line is not the full workforce budget
Carina’s plant staffing table lists 130 positions. The preceding text says the labour estimate includes process-plant staff only and excludes general and administrative personnel such as executive management, human resources and clerks. Salaries include base pay, benefits, bonuses and overtime; the source describes a local staffing assumption and a multi-crew shift arrangement.51
Consequently, US$0.38/t is a plant-labour line, not the labour cost of the whole project. Mine labour is within the mining estimate, and the separate support budget includes substantial salaries. Comparing that small line with another project’s broader staffing category would be misleading.52, 53, 54
| Item | Life-of-mine US$ million |
|---|---|
| Salaries | 123.5 |
| Personal protective equipment, transportation and food | 13.9 |
| Consumables | 1.3 |
| Travel | 3.2 |
| Recruitment and training | 12.0 |
| Local medical assistance | 15.7 |
| Equipment | 0.8 |
| IT systems and support | 14.4 |
| Office/facilities rental | 5.4 |
| Consulting, auditing and taxes — source grouping | 18.0 |
| Legal services | 9.0 |
| Cleaning and building maintenance | 7.2 |
| Insurance | 3.6 |
| ESG costs | 36.5 |
| Logistics | 34.5 |
| Published total | 299.1 |
The category names are retained. In particular, “consulting, auditing and taxes” does not establish which tax payments it contains, or justify equating it with income tax. Rounded component totals differ slightly from the published total. The table’s main contribution is to show how much supporting activity sits outside the plant-labour and plant-service lines.56
4. Colossus: mining ownership and carbonate refining matter
A traceable annual-to-tonne conversion
The Colossus cost table groups processing and transportation. It does not publish a comparable separate current-DFS reagent, power, maintenance and labour allocation in that table. We therefore retain the grouping instead of importing the older PFS’s detail or allocating the total using another project’s percentages.
| Cost centre | Reported average US$ million/year | Calculated US$/dry tonne |
|---|---|---|
| Mining and residue handling | 16.5 | 3.34 |
| Processing and transportation | 60.7 | 12.29 |
| General and administration | 3.7 | 0.75 |
| Published annual C1 / derived tonne cost | 81.0 | 16.40 |
The displayed annual components sum to US$80.9 million, against the rounded published total of US$81 million. The source average and period rows do not reconcile perfectly at their printed precision. We preserve the disclosed averages; the calculation does not claim access to an unrounded operating model.58
The low life-of-mine mine cost is not the initial contract rate
The mining section describes a market-based initial contract proposal at US$4.74/t ROM, covering mining, haulage, residue backfilling, rehabilitation, fleet maintenance and mining non-process infrastructure. It then assumes a transition to owner-operated mining in year 4.59
That explains why the narrative contract figure and a life-of-mine average are different types of measure, although it does not fully reconcile every cost difference. The US$3.34/t derived average must not be presented as the contractor’s initial quotation. Equally, replacing the life-of-mine line with US$4.74/t throughout would discard the study’s operating strategy.60, 61
The announcement explicitly says the initial contract strategy eliminates upfront owner mining-fleet capital. That does not establish zero fleet-related capital over the full evaluation period. The later transition and subsequent equipment requirements must be followed through the capital and operating schedules. The public combined sustaining/expansion line is not a separately disclosed fleet-replacement budget.62, 63
Colossus is therefore a mixed operating strategy, not a lifetime contract-mining comparator. The conversion to US$/dry tonne preserves that strategy; it does not make the estimate ownership-neutral.
“Processing” includes more than desorption
Colossus describes a flowsheet with scrubbing and classification, oversize regrind, ammonium-sulfate leaching, counter-current washing, residue filtration, impurity removal and carbonate precipitation. It also includes re-dissolution and purification of crude carbonate, a solvent-extraction step selectively removing lanthanum, and re-precipitation and bagging of refined MREC. Water and reagent recovery use ultrafiltration and reverse osmosis.64
This is not the same intermediate-production scope as simply stopping after the first carbonate precipitation. The study’s refining stage belongs inside the described production system; it is not a reason to add an arbitrary generic separation fee to plant OPEX. Conversely, it does not imply that the project’s cost covers delivery of a complete suite of separated individual oxides.
The source describes power, reagent, logistics and labour inputs informed by market engagement, specialist studies and operating testwork. That is useful evidence about estimate preparation. It is not an itemised public bill of materials from which the missing reagent and electricity allocations can be independently recreated.65
Sustaining and expansion expenditure sit outside C1
The same DFS lists US$10.5 million/year of average sustaining and expansion capital separately from C1, equivalent to approximately US$2.13 per dry tonne when divided by the same schedule. Its narrative identifies approximately US$6.9 million/year of sustaining capital and US$65 million of additional expansion expenditure over years 3–5, including the Southern Complex beneficiation hub, slurry pipelines and residue-filtration infrastructure.66
The narrative amounts should not be forced into the rounded combined table line as a perfect reconciliation. They establish that the operating layout evolves and that the C1 headline does not include every cash cost needed over the evaluated life. This article does not add those amounts to C1 and rename the result a standardised processing cost.
What changed from the PFS
| Metric | PFS, 9 July 2025 | DFS, 20 August 2026 |
|---|---|---|
| Evaluated period, years | 20 | 25 |
| Scheduled processed feed, million dry tonnes | 98.5 | 123.5 |
| Average annual C1 from detailed cost table, US$ million | 57.7 | 81.0 |
| Derived C1 per dry tonne, US$ | 11.72 | 16.40 |
The normalised difference is approximately US$4.68/t. The historical detailed table and some PFS summary figures differ, so Table 9 expressly uses the detailed cost-table basis. The later study also has a changed product-refining scope and evaluated schedule. The public information does not justify allocating the entire increase to inflation, scale or recovery efficiency.68, 69
5. Fleet ownership: who pays for the equipment?
Asset ownership and mine operation are separate questions
A mine can own equipment but employ a contractor to operate it. It can buy a bundled service that includes a contractor-supplied fleet. It can also combine owned, hired and leased equipment, or change arrangements during the mine life. Makuutu’s historical DFS is an explicit example of an owner-procured, contract-operated model: the project company supplies mechanical equipment and support, while a contractor operates and services the mobile fleet.70
The distinction matters because an operating-cost comparison can mix the cost of using equipment with the cost of providing equipment. In a contractor-supplied arrangement, the service rate can recover equipment provision together with operation, maintenance, contractor overhead and commercial return, subject to the contract scope. In an owner-purchased arrangement, operating costs still include the work of running the fleet, but capitalised purchases and replacements may sit elsewhere in the cash-flow model. Depreciation is an accounting allocation, not a second purchase payment; cash C1 definitions must be checked individually.71
This is an explanation of possible cost treatment, not a finding that contract mining invariably has higher OPEX or higher total cost. Different productivity, utilisation, scale, maintenance capability, risk allocation and commercial terms can change the outcome. An apparent reduction in cash OPEX can be offset by greater owner capital exposure; a higher service rate can include obligations that the owner would otherwise have to fund separately. The relevant question is the complete cost of the same service over the same period—not the label “owner” or “contractor”.72
| Project | Disclosed operating arrangement | Consequence for the cost comparison |
|---|---|---|
| Caldeira | Owner-mining estimate basis.73 | The mining operating line is not a demonstrated all-in charge for fleet acquisition, funding and replacement. Preserve separately recorded capital and hire items. |
| Colossus | Initial contract mining; owner operation anticipated in year 4. The initial strategy avoids upfront owner mining-fleet capital.74 | Its evaluated-life OPEX blends strategies. Do not compare its initial contractor rate with another project’s whole-life average or assume there are no later fleet requirements. |
| Carina | Contractor mining workforce with Aclara mine supervision.75 | Personnel responsibility alone does not establish who finances every machine or where all replacements are charged. No quantified fleet-ownership adjustment is supported here. |
| Makuutu — historical comparator | Owner-procured, contract-operated fleet and company support.76 | Contract operation does not necessarily remove equipment purchases from the owner’s capital budget. |
How to compare the same work without counting equipment twice
A proper owner-versus-contractor comparison would reconcile operating cash expenditure with initial fleet purchases, later conversion expenditure, replacements, major overhauls, rental or lease cash payments and disposal proceeds, as applicable. It would also match material movements, haul distances, availability, fuel and maintenance obligations, taxes and the tonnes processed over the same period. Timing and funding exposure matter; simply spreading the initial purchase price over all tonnes would not capture replacements or changes of operating strategy.
Each cash obligation must appear once. An all-in contractor rate should not be charged a second, assumed owner-fleet purchase unless the owner actually bears that obligation. A cash-life-cycle calculation should not add depreciation to purchases and replacements already counted. Equally, omitting separately funded owner equipment would understate the resources needed to deliver the service. Financing, lease payments and residual values require their own consistent convention, not an automatic adjustment to a source C1 number.77
The reviewed public disclosures do not supply a complete, matched fleet-financing and replacement schedule for all three Brazilian projects. No owner-equivalent or contract-equivalent unit cost is calculated in this article. The figures remain useful as disclosed operating estimates, but they are not a ranking of total fleet economics or total project expenditure.
6. What a like-for-like cost comparison can actually establish
Caldeira versus Colossus: locate the gap before explaining it
| Cost grouping | Caldeira | Colossus | Caldeira less Colossus |
|---|---|---|---|
| Mining and residue handling | 6.04 | 3.34 | 2.70 |
| Remainder of disclosed total — not processing alone | 16.18 | 13.06 | 3.12 |
| Total production OPEX | 22.22 | 16.40 | 5.82 |
Approximately 46% of this numerical gap falls within the mining/residue-handling categories. That locates expenditure; it does not prove that fleet ownership explains the difference. Caldeira uses an owner-mining basis, while Colossus plans to move from initial contract mining to owner operation. The table therefore cannot be described as a comparison of permanent owner mining against permanent contract mining.79, 80, 81
There are also physical differences worth investigating. Caldeira’s executive summary describes road haulage from Figueira and Soberbo and says pumping was evaluated but was more expensive because of ore rheology and power requirements. Colossus describes a Southern Complex beneficiation hub, slurry transport to the central plant and residue filtration near that hub. These are source-described design differences, not a quantified explanation of the whole mining-cost gap; activities may also be allocated differently between mining and processing.82, 83
The remaining difference is not a measured leaching-cost premium. It includes the source’s other operating categories, with processing, transport and overhead aggregated differently. The public schedules do not support assigning it wholly to reagents, recycling technology or contractor margin.
Carina versus Caldeira: category definitions still matter
The biggest risk is confusing an arithmetic difference with a causal explanation. Carina’s and Caldeira’s production totals differ by US$9.12/t; their reagent-related lines differ by US$7.81/t. However, Caldeira includes operating consumables with reagents, and the flowsheets and product quantities are not identical. The difference points to the chemical and consumables system as an important diligence topic; it does not prove that one recycling technology explains the gap.84
| Cost area | Caldeira | Carina | Colossus | Comparison limit |
|---|---|---|---|---|
| Mining and residue placement | 6.04 | 7.00 | 3.34, derived | Haulage, residue duties, operating strategy and separately funded fleet capital differ |
| Reagents / related consumables | 9.17 | 1.36 | Not separately disclosed in admitted cost table | Caldeira’s category is broader |
| Plant power | 1.27 | 1.25 | Not separately disclosed in admitted cost table | Tariff tax basis, load and operating hours require reconciliation |
| Plant labour | 1.83 | 0.38 | Not separately disclosed in admitted cost table | Staffing scope is not proven equivalent; Carina excludes G&A staff here |
| Maintenance | 1.23 | 0.63 supplies, with separate service/cloth lines | Not separately disclosed in admitted cost table | Different replacement and shutdown boundaries |
| Product transport | 1.54 | Separate logistics budget within G&A group | Combined with processing | Different packaging, routing and delivery boundaries |
Caldeira’s executive summary quotes 7.1 US cents/kWh including taxes; Carina’s plant estimate explicitly excludes tax and duties from utilities. Similar reported power expenditure per feed tonne therefore does not demonstrate the same energy efficiency or tariff. The source models need their energy quantities and tax treatment reconciled first.86, 87
Nor should a broader category be split using a competitor’s mix. If Colossus reports processing and freight together, assigning Carina’s chemical percentage to that total would create a number unsupported by the disclosure. A blank is more useful than a spurious estimate that looks comparable.
What would be needed for a genuinely normalised estimate?
The cost model would need reconciled fleet provision, operation and replacement costs as well as common definitions of delivered reagent specification and unit price; physical quantities per dry tonne; process endpoint; labour and service coverage; freight destination; recoverable and irrecoverable taxes; and maintenance versus capital replacements. Differences in those inputs should be adjusted transparently, not hidden inside a blanket “country factor”.
A reagent bill should be separated into quantity purchased × delivered unit price. Purchased concentration, moisture or chemical form must match the consumption basis. Circulating inventory and startup fills are not recurring purchases unless the process balance says they are lost and replaced. Likewise, “water recycling” and “reagent recovery” need their own mass or volume denominators before percentages can be compared.
These are proposed engineering controls, not additional numerical findings about the projects. The admitted public evidence does not establish a complete, standardised matrix for all three plants.
7. Scale: distinguish fixed-cost dilution from designing a different plant
Carina’s larger dry-feed rate makes scale a reasonable question. It does not make scale the demonstrated explanation for its lower tonne-based cost. Different ore, impurity loads, equipment duties, product treatment, tax bases and staffing categories are changing simultaneously.
For a particular installed plant, a simplified cost identity is:
Unit operating cost = variable expenditure per tonne + annual fixed expenditure ÷ annual tonnes actually treated.
This describes one mechanism. It does not mean all mining and process costs are either perfectly fixed or perfectly variable, or that a plant can double throughput without additional equipment.
Caldeira gives an unusually useful starting point because it explicitly classifies labour, maintenance and general expenses as fixed plant costs. Their displayed tonne-based lines add to US$4.21/t. The following illustration changes only the allocation of that fixed block; it does not resize equipment, change the mine plan or forecast the complete project OPEX.88
| Throughput relative to reference | Fixed-block allocation, US$/tonne | Increase in that allocation, US$/tonne |
|---|---|---|
| 100% | 4.21 | — |
| 90% | 4.68 | 0.47 |
| 80% | 5.26 | 1.05 |
The formula is reference fixed-block cost per tonne ÷ relative throughput. The example shows why under-utilisation matters without pretending to estimate the cost of a smaller purpose-built plant.90
Building a different plant requires a different exercise. Equipment sizes and parallel trains, pumps, filters, water-treatment capacity, staffing, maintenance and infrastructure may change in steps. Lower annual throughput may also change haul distance, feed selection and the time spent moving residues. We have not fitted a scaling exponent across unrelated projects or used one company’s cost to forecast another’s.
The source-year distinction also matters. Caldeira’s executive summary contains a 6 million-tonne base-case cost distribution, whereas its headline table provides a life-of-mine distribution. The base-case percentages are not multiplied by the life-of-mine total to manufacture a detailed cost breakdown.91, 92
8. International context: useful differences, not a global cost curve
International disclosures broaden the analysis but do not create a single population of comparable plants. Historical cost dates, heap systems, different delivery points and incomplete cost schedules stay attached to the evidence.
Makuutu, Uganda: the cost label and freight boundary both matter
Makuutu’s March 2023 Stage 1 DFS and subsequent clarification report approximately US$12.40/t ROM. The original detailed table calls its tonne figure OPEX and explicitly identifies dry feed; the headline and clarification use AISC. The clarification includes mining, administration, reagents, transport through Mombasa and shipping to a nominated US East Coast refinery location.93
We retain the source’s clarified AISC label. We do not rank this older, broader measure beside current Brazilian C1 as though it were the same service and the same cost year.
The operating model is owner-procured but contract-operated: the source states that the project company supplies mechanical equipment and support, while a contractor operates and services mobile equipment. Process operating costs were estimated using an interim mass balance to determine reagents and consumables. That is a different ownership and estimation boundary from assuming the contractor supplies everything.94
| Original OPEX category | Published share |
|---|---|
| Mining | 27% |
| Reagents | 35% |
| Processing and environmental costs | 26% |
| G&A | 12% |
The original summary also lists cost components totalling US$2,326 million, against a stated total of US$2,143 million. That source non-closure is another reason not to create a supposedly precise, current plant-only dollar figure from the disclosure. No replacement total is adopted here.96
Ampasindava, Madagascar: processing is not its entire ROM cost
Harena’s 26 January 2026 pre-feasibility announcement describes a mined-clay heap system with agglomeration, irrigation, solution collection and treatment, washing and return of spent material. It is a PFS, not a DFS. The source says its study uses Measured and Indicated resources and that a Mineral Reserve has not yet been estimated; the projected cost and development outcome are not demonstrated results.97
| Cost category | Reported US$/tonne ROM |
|---|---|
| Mining | 9.60 |
| Processing | 11.90 |
| Other direct costs | 5.70 |
| Overheads | 3.90 |
| Reported total | 31.10 |
The other-direct and overhead lines are material, but the announcement does not provide enough detail to redistribute them into harmonised reagent, power or labour rows. Its cost basis cites contractor input from other African projects, Australian engineering consultants and local cost indexes; those are the reported estimation inputs, not evidence of delivered operating performance.99
The source also states that transport from Madagascar to the separation customer is reflected in its commercial deduction rather than necessarily in the quoted OPEX. This does not make that service free or establish the same delivery boundary as the Brazilian rows. No sales-value calculation is introduced here.100
The development narrative identifies 88 million dry tonnes, while Table 4 labels its unit-cost column simply ROM. The disclosure offers dry-schedule context, but it does not justify inventing a different wet/dry or leach-feed adjustment. Its annual component costs sum to US$139.0 million, against a stated US$136.9 million; life-of-mine components sum to US$2,738.8 million, against a stated US$2,743 million. Those differences remain unresolved and do not replace the quoted ROM table.101
Ema and other projects: do not fill gaps with false precision
Ema, Brazil, is retained as qualitative process context only. Its in-situ recovery design is not a surface plant receiving an excavated dry-ore feed stream. The cited source explicitly includes wellfield operating expenditure as an all-in allowance in G&A. The appropriate cost system therefore follows injection/contact, collection, pumping, treatment, monitoring and wellfield operations; this article does not reproduce Ema’s numerical economic forecasts or manufacture a dry-tonne comparator.102
For Koppamurra, Australia, the admitted later issuer report describes a heap route and off-site oxide conversion, but the detailed original PFS has not been reverified in this research record. No granular or tonne-based cost is inserted here. Nor is its product-mass cost converted using an unconfirmed feed denominator.103
For Penco, Chile, the reviewed announcement treated an FS as future work; no new matched tonne-cost schedule is inferred here.104
For Serra Verde’s Pela Ema, Brazil, public financial disclosures do contain historical accounting expenses and selected transaction forecasts. They do not, in the material admitted to this article, establish a reconciled steady-state mine-to-carbonate cost per dry tonne. Cost of sales, inventory effects and forecast earnings are not substituted for matched ore-treatment expenditure. No conditional ROM-tonne screening estimate is included in the comparative chart. BCM’s Ema and Serra Verde’s Pela Ema are different projects.105
This review likewise does not establish a harmonised, current mine-level cost dataset for China or other Asian production. Absence from the table is not evidence that a producer is high cost or low cost. The article compares identified public studies; it is not a global operating-cost curve.
9. Costs beyond the headline: keep them visible, but separate
Excluding sales assumptions does not mean excluding every boundary problem. Some cash outflows are not physical production OPEX, and some recurring costs can move between OPEX and capital depending on the source convention.
Royalties and government charges. Caldeira describes royalties, government imposts and sustaining capital outside its headline C1; Colossus lists royalties/fees and sustaining/expansion expenditure separately. Their amount can depend on a source’s financial assumptions. We therefore do not import a royalty line from one price case to claim a standard physical processing cost. A project with no private royalty cannot subtract it from a C1 estimate that already excludes it.106, 107
Indirect taxes. Caldeira’s model assumes imported-reagent ICMS exemption under the source’s stated export condition; its quoted power basis includes taxes. Carina expressly excludes taxes and duties in selected plant input estimates and treats indirect taxes elsewhere in its cash-flow model. “Tax excluded” is not a single, project-wide status that can safely be assigned from one sentence.108, 109, 110, 111
Fleet provision and replacement. Cash operating costs can omit owner-funded fleet purchases that a contractor-supplied rate recovers over time. Asset ownership and operation must be checked separately, and a transition strategy must be followed through the life of the source model. The operating comparison here is not adjusted for those unresolved capital differences.112, 113
Maintenance, sustaining works and closure. Carina’s plant maintenance and separate mine/infrastructure sustaining schedules illustrate why the replacement boundary must be examined. Colossus’s future beneficiation and residue infrastructure illustrate why an initially modest layout can require additional capital later. These costs should be recorded separately, not omitted or automatically charged twice.114, 115, 116
Downstream separation and sales deductions. A mine-to-carbonate estimate does not establish the full cost of producing separated individual oxides. A buyer’s commercial deduction is not automatically the seller’s physical operating expense. This article identifies that boundary but does not assign separation prices, payability percentages or revenue to it.
Initial construction and working capital. Neither is converted into a recurrent cost per tonne here. A capital-amortisation calculation requires its own time, financing and throughput assumptions. Mixing it into OPEX without an explicit method would defeat the cost comparison rather than improve it.
10. What a developer should measure before adopting a peer benchmark
The practical outcome is a specification for an auditable cost model, not a universal target number. The starting point is a representative mine and feed schedule linked to a defined process and product endpoint.
The material-handling record should distinguish ore, waste, coarse rejects and residues; dry and wet mass; haul distances; placement duties; and contractor versus owner scope. The process record should connect fresh chemical purchases, circulating inventory, liquid retention, bleed streams and water treatment. Operating hours, electrical loads and equipment duties should be reconciled before converting them into energy per tonne.
Staffing must be mapped across mine, plant, site support and corporate functions. The maintenance register should identify spares, wear parts, membrane and resin replacement, shutdown labour, contractor support and capitalised replacements. Freight should identify packaging, destination and responsibility. Costs should be linked to their actual drivers—material treated, impurities removed, operating hours, equipment installed or services retained—rather than forced to scale with a single output measure.
Finally, retain the estimate basis: source date, currency, exchange rate, supplier scope, tax treatment, contingency, design year, life-of-mine period and unresolved allocations. When a figure is derived, publish the calculation. When a line is unavailable, leave it unavailable. When tables do not reconcile, record the difference and seek clarification rather than constructing a more convenient number.
Conclusion: understand the cost before comparing the headline
The Brazilian studies provide useful but differently structured evidence. Caldeira exposes a significant reagent-and-consumables budget and specific changes arising from testwork and revised service estimates. Carina shows how a small hydrometallurgical cost sits beside mining, support, staffing and maintenance boundaries that must remain visible. Colossus demonstrates why mining ownership, a refined-carbonate flowsheet and later infrastructure expenditure affect the meaning of its headline C1.
The main analytical result is not a declaration that the lowest reported total is universally achievable. It is that the cost of processing a tonne must be attached to the exact tonne, process, product, period and accounting boundary being costed. A number stripped of those definitions cannot carry the comparison.
Coming next in Research & Insights: a separate examination of what each processed tonne is worth, the individual rare-earth price assumptions used in public feasibility studies, and the commercial deductions between reference prices and product revenue. That follow-up will distinguish issuer forecasts from common-price and common-payability comparisons. No such revenue or margin comparison is made in this article.
Sources, calculations and research limits
The notes identify controlling documents, source dates and printed/PDF-viewer page locations. A source note attached to a table caption supports the reported entries; derived entries identify their method. Formula checks reproduce arithmetic from those inputs and do not validate the underlying engineering. Repeated citations are not independent corroboration.
This edition adds a targeted review of fleet ownership, contractor operation and operating-versus-capital treatment to the preceding cost review. It includes inspection of the supplied Carina mining-workforce and cost pages. Other retained numerical tables inherit the preceding source-review scope; this amendment is not a fresh independent validation of every engineering input. Not every source PDF was successfully retrieved as a new local file or rendered by the web reader. Carina’s issuer page links the same report identifier as the supplied copy; anonymous end-user full-file access remains a publication check. The Koppamurra detailed-source limitation is retained. Source access, source accuracy and engineering validation are separate questions.117
Estimates remain on their source dates. This is not a representation that no later disclosure exists, that every project has attained its stated capacity, or that the public studies cover all industry production. Material subsequent information must be considered before republication. No confidential Magnes assay, leachate, product-value or process-cost estimate is included.
Important notices and legal disclaimer
Purpose, publisher interest and scope
This article is sponsored by Magnes Rare Earths (Magnes) and is prepared for general information and discussion of publicly disclosed rare-earth project studies. Magnes is a project developer with a commercial interest in the sector. The article is issuer-sponsored material, not independent investment research, an independent expert report or an impartial recommendation among investment opportunities. Editorial and analytical preparation included artificial-intelligence assistance; that assistance does not replace professional judgement, source verification or the publisher’s legal responsibilities.
The article’s conclusions concern the specific third-party disclosures identified. They are not conclusions about the value, financing, development prospects or investment merits of Magnes, Verde AgriTech or any other security. Neither a shared geological description nor a location in the same country establishes that another project’s results are achievable at a Magnes property.
No Magnes resource, production or economic forecast
Nothing in this article establishes or updates a mineral resource, mineral reserve, exploration target, recovery estimate, production target, mine life, capital or operating-cost estimate, project valuation or economic assessment for a Magnes property. It is not a development decision or a statement that a Magnes project is technically feasible, economically viable, permitted, financed or capable of commercial production. Formal project-specific disclosure must be considered on its own terms.
A reference to a feasibility study, qualified person, competent person, laboratory, engineering firm, exchange or regulator identifies the source or reporting context. It does not state that that person or organisation has reviewed, approved, endorsed or accepted responsibility for this article or its calculations. No source author’s consent or professional sign-off for this article is implied.
Third-party information and verification limits
Reported estimates are attributed to the named sources and retain the qualifications specified beside them. Source tracing, selected page-image checks and recalculation do not independently validate the underlying geology, sampling, metallurgy, engineering, cost quotations, legal rights, environmental assumptions, resource classifications or commercial forecasts. The preparation and source review described here did not independently re-create the source engineering models or inspect the referenced operations. This statement describes the scope of this review, not every activity ever undertaken by Magnes or its personnel.
The article is not an exhaustive account of every material fact affecting the projects discussed. Information may be incomplete, rounded, internally inconsistent or superseded. Specific unresolved matters are disclosed in the text and notes rather than assumed away. Readers should review the underlying documents, their cautionary statements and subsequent formal disclosures. Links identify the evidence cited and facilitate verification; they are not a claim that every statement in a linked document has been reviewed. Magnes remains responsible for its own selection, calculations, descriptions and presentation. Attribution, an external-link label or a statement that material is not endorsed does not, by itself, determine legal responsibility or cure a misleading statement or omission.118
Forward-looking statements and material assumptions
Descriptions of forecast costs, scheduled feed or output, recoveries, plant performance, product quality, reagent use, sale terms, development or potential economic outcomes may constitute forward-looking statements or forward-looking information, even when attributed to an earlier published study. Such statements are not historical operating results. Words such as “estimated”, “scheduled”, “expected”, “potential”, “would” and similar expressions may identify them, but their absence does not make a statement historical.
The numerical comparisons assume, for the limited purpose of reproducing the cited studies, the source schedules, product definitions, recoveries, operating availability, estimate scope and price/currency bases specified in the relevant notes. No uniform inflation adjustment, universal commercial payability or common engineering performance has been assumed. Derived ratios are conditional on the accuracy and compatibility of their stated inputs and are not newly optimised project models.
Actual costs and outcomes may differ materially because of geological variability, resource conversion, mining dilution, desorbable mineral content, impurity dissolution, reagent consumption or recycling, solid–liquid separation, hydraulic contact and solution capture, product losses, plant scale-up, utilisation, equipment reliability, energy and water availability, labour, transport, residue management, rehabilitation and closure. Additional risks include permitting and community or landholder requirements, financing and working capital, development delays, exchange rates, inflation, tax and royalty changes, rare-earth prices and demand, customer qualification, product specifications, treatment capacity, counterparty performance, sanctions, trade restrictions and other legal or political changes.
These factors are not exhaustive. Source-study confidence and forward-looking assumptions differ among projects. No assurance is given that any described cost, output, sale term or development outcome will be achieved. The article does not establish reasonable grounds for a new forecast merely by describing it as research, illustrative or conditional.
Study maturity, accounting measures and comparability
Feasibility, definitive, bankable and pre-feasibility labels identify the terminology used in the cited disclosures, not a certification that all estimates have equal maturity or assurance. Where a source includes Inferred material or does not establish an Ore Reserve, the related uncertainty remains; such material must not be treated as having the same confidence as a reserve-supported schedule. Mineral resources that are not mineral reserves do not, by that classification alone, demonstrate economic viability.
C1, AISC, production OPEX and related ratios are source-specific operating or financial measures and may lack a standardised meaning under generally accepted accounting principles or International Financial Reporting Standards. Their composition, exclusions and denominators must be read with each table. They are not interchangeable with profit, cash flow, a project valuation or the full cost of producing separated oxides. No consolidated Magnes financial measure or universal cost curve is presented. Source classification does not itself establish an exemption from a financial-measure rule. Any legally required definition, reconciliation or other disclosure must be supplied where applicable; this notice is not a substitute for it.
United States
This article is not a registration statement or prospectus and is not intended as an offer to sell or a solicitation to buy a security. Its regulatory treatment depends on its content, context and use, not on that description alone. It does not represent that a security, project or publication has been approved by the U.S. Securities and Exchange Commission, another regulator or an exchange. References to foreign mining reports do not recast their estimates as disclosure prepared under Regulation S-K Subpart 1300, and this article is not a Magnes technical report summary under that regime.119
No representation is made that the statutory forward-looking-statement safe harbours are available to Magnes, this article or any particular statement or transaction. Their availability depends on the applicable issuer eligibility, statutory conditions and transaction exclusions, including initial public offerings. The statutory provisions address specified private civil actions; they are not a general exemption from regulatory enforcement or other applicable law. Any protection is asserted only to the extent it is legally available; nothing here limits applicable antifraud obligations or enforcement authority.120
Canada
References to National Instrument 43-101 and Canadian technical reports identify source standards and do not constitute a new technical report, qualified-person certification or exemption for this article. Applicable requirements concerning scientific and technical disclosure, qualified-person responsibility, restricted disclosure, filing and consent are not displaced by describing this material as an industry comparison. In particular, quoting an external study title is not a determination that the study satisfies Canadian definitions, and a general caution is not an exemption permitting otherwise restricted disclosure.121
Where applicable, Canadian forward-looking-information and financial-measure requirements continue to apply. Identification of risks does not replace a reasonable basis for a statement, the disclosure of material assumptions, or any required update, reconciliation or professional approval. This article does not purport to waive those obligations.122, 123
Australia
References to JORC, an Ore Reserve, a competent person or an ASX announcement retain their source context. They do not imply that Magnes is ASX-listed, that this article has been prepared or consented to as a JORC public report, or that a source competent person has approved this comparison. The applicable reporting requirements must be assessed for the actual publisher, communication and circumstances.
Statements about future matters require the grounds and disclosure required by applicable Australian law. A caution, qualification or disclaimer cannot cure a statement that lacks reasonable grounds or is otherwise misleading. Relevant qualifications must remain with the information when it is displayed or reproduced; this notice is not permission to separate a headline from the limitations needed to understand it.124, 125
No investment advice, offer or personal recommendation
The article is not intended to recommend acquiring, disposing of or holding any security, and is not personal financial, investment, legal, tax or engineering advice. Describing it this way does not decide whether a communication is regulated advice, a financial promotion or an offering communication; that question depends on the applicable law and circumstances. It does not take account of any reader’s objectives, financial circumstances or needs, does not assess suitability, and should not be used as the sole basis for an investment, financing, offtake or development decision. Readers should obtain appropriately qualified advice. The article does not create an advisory, fiduciary or professional-client relationship merely because it is read, downloaded or discussed.
No statement promises a return, price performance, liquidity, financing outcome or listing. Any securities transaction would require its own lawful process and applicable offering and disclosure documents. Publication on a website does not authorise distribution or use in a jurisdiction or transaction where that use would be unlawful.
Dates, corrections, third-party rights and statutory safeguards
Study data speak as of their identified source dates. The preparation date is not a representation that every project estimate has been updated to that date. Except where required by applicable law, Magnes gives no undertaking to continuously update third-party forecasts, prices or calculations. That qualification does not limit any duty to correct a material misstatement, update disclosure or make a required filing. Later authoritative disclosure may supersede this article.
External links may change or become unavailable. Third-party names, materials and intellectual property remain subject to their owners’ rights. Attribution does not imply permission to reproduce a complete source report. Any authorised excerpt, table, image, translation or social-media reproduction must retain the source date, attribution, units, material qualifications and source route needed to understand it. A contextless cost headline must not imply Magnes economics or source-author or regulatory endorsement. An abridgement that cannot preserve a necessary qualification should not be used.
Nothing in this notice excludes, restricts or modifies a right, remedy, duty or liability that cannot lawfully be excluded, restricted or modified, including under applicable securities, consumer-protection or antifraud law. It does not require a reader to waive statutory rights or excuse a materially false or misleading statement or omission. The purpose of these notices is to explain the article’s scope and limitations, not to replace accurate disclosure or create immunity from legal responsibility.
Meteoric Resources, Caldeira DFS Confirms Confidence in Project Fundamentals to Support Offtake and Financing, 31 July 2026, Table 5 and Operating Costs, printed/PDF p. 14; repeated in Table 1-20, printed p. 1-73 / PDF p. 113. The table uses source C1 and Q1 2026 cost inputs; site G&A is in the plant framework. Annual figures and unit figures are reproduced, not recomputed from initial capacity.↩︎
Aclara/Hatch and contributing qualified persons, NI 43-101 Technical Report — Carina Project, Goiás, Brazil, effective 20 March 2026, Table 21-3, printed p. 310 / PDF p. 330; Table 22-5, printed p. 320 / PDF p. 340; issuer report-access page. The full supplied PDF is the page-level source. Source totals: mining 1,196.7, plant 738.6, G&A/ESG/logistics 299.1, total 2,234.4 million US$; corresponding reported feed costs 7.0, 4.3, 1.8 and 13.1 US$/t. These are feed costs; the separate REO-column unit-heading issue is not used to recalculate them.↩︎
Viridis Mining and Minerals, Colossus DFS Confirms Project Bankability and Execution Readiness, 20 August 2026, processed-feed schedule, p. 32; Table 12, p. 37. Author denominator = 123.5 million dry t / 25 years = 4.94 million t/year. Annual cost lines 16.5, 60.7 and 3.7 million US$ divide by 4.94 to give 3.3401, 12.2874 and 0.7490 US$/t. Published total 81 / 4.94 = 16.3968 US$/t. The annual components sum to 80.9; the printed total is 81. Published period and average columns do not fully close at displayed precision.↩︎
Author methodological interpretation, not an issuer cost adjustment. The IFRS Foundation’s IAS 16 overview, “About” section, accessed 22 September 2026, distinguishes equipment asset cost from depreciation; it does not define cash C1. Project-specific evidence is in the fleet-arrangements table and its notes. Equipment funding, contract scope, leases, replacement timing and service productivity require their own reconciliation. No contractor premium, standardised capital-adjusted cost or universal cost advantage is assumed.↩︎
Meteoric Resources, Caldeira DFS Confirms Confidence in Project Fundamentals to Support Offtake and Financing, 31 July 2026, Table 5 and Operating Costs, printed/PDF p. 14; repeated in Table 1-20, printed p. 1-73 / PDF p. 113. The table uses source C1 and Q1 2026 cost inputs; site G&A is in the plant framework. Annual figures and unit figures are reproduced, not recomputed from initial capacity.↩︎
Meteoric Resources, Caldeira DFS Confirms Confidence in Project Fundamentals to Support Offtake and Financing, 31 July 2026, Table 1, p. 4; Processing, p. 9; Table 1-19, printed p. 1-71 / PDF p. 111. Initial plant rate 6.0 million dry t/year; matching life-of-mine feed is 151.071 million dry t. Initial capacity is not substituted for scheduled average throughput.↩︎
Aclara/Hatch and contributing qualified persons, NI 43-101 Technical Report — Carina Project, Goiás, Brazil, effective 20 March 2026, Table 21-3, printed p. 310 / PDF p. 330; Table 22-5, printed p. 320 / PDF p. 340; issuer report-access page. The full supplied PDF is the page-level source. Source totals: mining 1,196.7, plant 738.6, G&A/ESG/logistics 299.1, total 2,234.4 million US$; corresponding reported feed costs 7.0, 4.3, 1.8 and 13.1 US$/t. These are feed costs; the separate REO-column unit-heading issue is not used to recalculate them.↩︎
Aclara/Hatch and contributing qualified persons, NI 43-101 Technical Report — Carina Project, Goiás, Brazil, effective 20 March 2026, §21.3.2 and Table 21-5, printed p. 311 / PDF p. 331; issuer report-access page. The full supplied PDF is the page-level source. Plant line items, tax/duty and escalation exclusions, and absence of plant OPEX contingency are source statements. Table notes specify 9,713 kt/year dry feed in a nominal standard year; that is distinct from a LOM average.↩︎
Viridis Mining and Minerals, Colossus DFS Confirms Project Bankability and Execution Readiness, 20 August 2026, processed-feed schedule, p. 32; Table 12, p. 37. Author denominator = 123.5 million dry t / 25 years = 4.94 million t/year. Annual cost lines 16.5, 60.7 and 3.7 million US$ divide by 4.94 to give 3.3401, 12.2874 and 0.7490 US$/t. Published total 81 / 4.94 = 16.3968 US$/t. The annual components sum to 80.9; the printed total is 81. Published period and average columns do not fully close at displayed precision.↩︎
Viridis Mining and Minerals, Colossus DFS Confirms Project Bankability and Execution Readiness, 20 August 2026, Processing and Metallurgy, pp. 25 and 28–29; Key Processing Steps and High-Value Refined MREC Product. The described system includes beneficiation, regrind, leaching, CCD, filtration, impurity removal, crude-MREC precipitation, re-dissolution, polishing/solvent extraction and re-precipitation, plus UF/RO water and reagent recovery. The document does not disclose a separate current-DFS dollar allocation for every operation.↩︎
Aclara/Hatch and contributing qualified persons, NI 43-101 Technical Report — Carina Project, Goiás, Brazil, effective 20 March 2026, §21.3.2 and Table 21-5, printed p. 311 / PDF p. 331; issuer report-access page. The full supplied PDF is the page-level source. Plant line items, tax/duty and escalation exclusions, and absence of plant OPEX contingency are source statements. Table notes specify 9,713 kt/year dry feed in a nominal standard year; that is distinct from a LOM average.↩︎
Meteoric Resources, Caldeira DFS Confirms Confidence in Project Fundamentals to Support Offtake and Financing, 31 July 2026, Table 1, p. 4; Processing, p. 9; Table 1-19, printed p. 1-71 / PDF p. 111. Initial plant rate 6.0 million dry t/year; matching life-of-mine feed is 151.071 million dry t. Initial capacity is not substituted for scheduled average throughput.↩︎
Viridis Mining and Minerals, Colossus DFS Confirms Project Bankability and Execution Readiness, 20 August 2026, processed-feed schedule, p. 32; Table 12, p. 37. Author denominator = 123.5 million dry t / 25 years = 4.94 million t/year. Annual cost lines 16.5, 60.7 and 3.7 million US$ divide by 4.94 to give 3.3401, 12.2874 and 0.7490 US$/t. Published total 81 / 4.94 = 16.3968 US$/t. The annual components sum to 80.9; the printed total is 81. Published period and average columns do not fully close at displayed precision.↩︎
Meteoric Resources, Caldeira DFS Confirms Confidence in Project Fundamentals to Support Offtake and Financing, 31 July 2026, attached executive summary §1.4.6, printed p. 1-25 / PDF p. 65, and announcement “Costs”, p. 22. The estimate expressly uses an owner-mining solution; additional handling and site duties are identified separately in its cost build-up. The source does not establish that the quoted feed-tonne mining OPEX is a complete fleet acquisition, funding and replacement charge.↩︎
Viridis Mining and Minerals, Colossus DFS Confirms Project Bankability and Execution Readiness, 20 August 2026, “Contract Mining” and “Project Capital Cost Estimate and Procurement” sections. The narrative states an initial 4.74 US$/t ROM contract rate covering mining, haulage, residue backfilling, rehabilitation, fleet maintenance and mining NPI; it states that the initial contract strategy eliminates upfront owner mining-fleet capital and anticipates transition to owner operation in year 4. This review cites those section headings rather than assigning an unconfirmed page number. The later fleet-capital allocation is not independently reconstructed.↩︎
Aclara/Hatch and contributing qualified persons, NI 43-101 Technical Report — Carina Project, Goiás, Brazil, effective 20 March 2026, §16.5 and Tables 16-8 to 16-10, printed pp. 185–186 / PDF pp. 205–206; issuer report-access page. Page images of the supplied full report were inspected for this revision. The text distinguishes direct Aclara mine-supervision staff and contractor mining operations. This is not, by itself, evidence of a complete contractor-funded equipment package; no workforce totals or fleet-funding premiums are inferred.↩︎
Meteoric Resources, Caldeira DFS Confirms Confidence in Project Fundamentals to Support Offtake and Financing, 31 July 2026, Table 5, p. 14. Author plant-related sum excluding mining and separately listed product transport = 1.83 + 1.23 + 1.15 + 1.27 + 9.17 = 14.65 US$/dry t; rounded-total residual = 22.22 − 6.04 − 1.54 = 14.64. Full displayed line sum = 22.23; reported total = 22.22. No 0.01 adjustment is manufactured.↩︎
Aclara/Hatch and contributing qualified persons, NI 43-101 Technical Report — Carina Project, Goiás, Brazil, effective 20 March 2026, Table 21-3, printed p. 310 / PDF p. 330; Table 22-5, printed p. 320 / PDF p. 340; issuer report-access page. The full supplied PDF is the page-level source. Source totals: mining 1,196.7, plant 738.6, G&A/ESG/logistics 299.1, total 2,234.4 million US$; corresponding reported feed costs 7.0, 4.3, 1.8 and 13.1 US$/t. These are feed costs; the separate REO-column unit-heading issue is not used to recalculate them.↩︎
Aclara/Hatch and contributing qualified persons, NI 43-101 Technical Report — Carina Project, Goiás, Brazil, effective 20 March 2026, §21.3.2 and Table 21-5, printed p. 311 / PDF p. 331; issuer report-access page. The full supplied PDF is the page-level source. Plant line items, tax/duty and escalation exclusions, and absence of plant OPEX contingency are source statements. Table notes specify 9,713 kt/year dry feed in a nominal standard year; that is distinct from a LOM average.↩︎
Viridis Mining and Minerals, Colossus DFS Confirms Project Bankability and Execution Readiness, 20 August 2026, processed-feed schedule, p. 32; Table 12, p. 37. Author denominator = 123.5 million dry t / 25 years = 4.94 million t/year. Annual cost lines 16.5, 60.7 and 3.7 million US$ divide by 4.94 to give 3.3401, 12.2874 and 0.7490 US$/t. Published total 81 / 4.94 = 16.3968 US$/t. The annual components sum to 80.9; the printed total is 81. Published period and average columns do not fully close at displayed precision.↩︎
Meteoric Resources, Caldeira DFS Confirms Confidence in Project Fundamentals to Support Offtake and Financing, 31 July 2026, Table 5, p. 14. Aclara/Hatch and contributing qualified persons, NI 43-101 Technical Report — Carina Project, Goiás, Brazil, effective 20 March 2026, Table 21-3, printed p. 310 / PDF p. 330; issuer report-access page. The full supplied PDF is the page-level source. Viridis Mining and Minerals, Colossus DFS Confirms Project Bankability and Execution Readiness, 20 August 2026, feed p. 32 and Table 12, p. 37. The article chart uses each headline total, minus mining, for the remainder. Remainders are 16.18 for Caldeira, 6.10 for Carina and approximately 13.06 for Colossus, US$/dry t. This aggregation is not a processing-only comparison. Owner-funded fleet capital is not added to C1; no ownership-neutral cost comparison is implied.↩︎
Meteoric Resources, Caldeira DFS Confirms Confidence in Project Fundamentals to Support Offtake and Financing, 31 July 2026, Table 5 and Operating Costs, printed/PDF p. 14; repeated in Table 1-20, printed p. 1-73 / PDF p. 113. The table uses source C1 and Q1 2026 cost inputs; site G&A is in the plant framework. Annual figures and unit figures are reproduced, not recomputed from initial capacity.↩︎
Meteoric Resources, Caldeira DFS Confirms Confidence in Project Fundamentals to Support Offtake and Financing, 31 July 2026, Table 5 and Operating Costs, printed/PDF p. 14; repeated in Table 1-20, printed p. 1-73 / PDF p. 113. The table uses source C1 and Q1 2026 cost inputs; site G&A is in the plant framework. Annual figures and unit figures are reproduced, not recomputed from initial capacity.↩︎
Meteoric Resources, Caldeira DFS Confirms Confidence in Project Fundamentals to Support Offtake and Financing, 31 July 2026, Table 5, p. 14. Author plant-related sum excluding mining and separately listed product transport = 1.83 + 1.23 + 1.15 + 1.27 + 9.17 = 14.65 US$/dry t; rounded-total residual = 22.22 − 6.04 − 1.54 = 14.64. Full displayed line sum = 22.23; reported total = 22.22. No 0.01 adjustment is manufactured.↩︎
Meteoric Resources, Caldeira DFS Confirms Confidence in Project Fundamentals to Support Offtake and Financing, 31 July 2026, attached executive summary §1.4.6, printed pp. 1-25–1-26 / PDF pp. 65–66. Source describes ROM-pad, grade-control, ore-haulage and spent-clay-rehandling duties. Road haulage for Figueira and Soberbo is discussed, with pumping evaluated as more costly because of rheology and pumping-power requirements. These statements identify a design basis, not a reconciled dollar saving versus Colossus.↩︎
Meteoric Resources, Caldeira DFS Confirms Confidence in Project Fundamentals to Support Offtake and Financing, 31 July 2026, attached executive summary §1.4.6, printed p. 1-25 / PDF p. 65, and announcement “Costs”, p. 22. The estimate expressly uses an owner-mining solution; additional handling and site duties are identified separately in its cost build-up. The source does not establish that the quoted feed-tonne mining OPEX is a complete fleet acquisition, funding and replacement charge.↩︎
Author methodological interpretation, not an issuer cost adjustment. The IFRS Foundation’s IAS 16 overview, “About” section, accessed 22 September 2026, distinguishes equipment asset cost from depreciation; it does not define cash C1. Project-specific evidence is in the fleet-arrangements table and its notes. Equipment funding, contract scope, leases, replacement timing and service productivity require their own reconciliation. No contractor premium, standardised capital-adjusted cost or universal cost advantage is assumed.↩︎
Meteoric Resources, Caldeira DFS Confirms Confidence in Project Fundamentals to Support Offtake and Financing, 31 July 2026, Table 1-17, printed p. 1-69 / PDF p. 109; Table 1-19, printed p. 1-71 / PDF p. 111; Table 5, p. 14. Source life 23 years and feed 151.071 million dry t imply 6.568304 million t/year. 145.98 / 6.0 = 24.33 US$/t is the mismatched-initial-capacity illustration. Using the schedule average gives approximately 22.2249, consistent with the reported 22.22 within rounding. No new capacity design is inferred.↩︎
Meteoric Resources, Caldeira DFS Confirms Confidence in Project Fundamentals to Support Offtake and Financing, 31 July 2026, §1.13, printed p. 1-62 / PDF p. 102. The engineering base case is 6 Mt/year; reagent quantities come from mass balance and delivered supplier quotations. Power is 7.1 US cents/kWh including taxes. Figure 1-30 is a base-case distribution, not the LOM Table 5 cost allocation.↩︎
Meteoric Resources, Caldeira DFS Confirms Confidence in Project Fundamentals to Support Offtake and Financing, 31 July 2026, §1.5.2, printed p. 1-27 / PDF p. 67; §1.12.4, printed pp. 1-61–1-62 / PDF pp. 101–102. Source describes whole-feed treatment, additional sizing/grinding/screening and a more complex water-recovery system after further testwork. It does not establish the same requirements for other ores.↩︎
Meteoric Resources, Caldeira DFS Confirms Confidence in Project Fundamentals to Support Offtake and Financing, 31 July 2026, §1.13.1, printed p. 1-63 / PDF p. 103. Source comparisons: flocculant 16.5 to 6.9 million US$/year; reagent quotation changes 25%, 68%, 7%; power 6 to 7.1 US cents/kWh; general expenses 6.26 to 14.80 million US$; anticipated laboratory saving 1.45 million US$/year from year 3. Author flocculant difference = 9.6 million / 6 million base-case tonnes = 1.60 US$/t. Base-case and LOM figures remain distinct; already-included savings are not deducted again.↩︎
Meteoric Resources, Caldeira DFS Confirms Confidence in Project Fundamentals to Support Offtake and Financing, 31 July 2026, §1.13.1, printed p. 1-63 / PDF p. 103. Source comparisons: flocculant 16.5 to 6.9 million US$/year; reagent quotation changes 25%, 68%, 7%; power 6 to 7.1 US cents/kWh; general expenses 6.26 to 14.80 million US$; anticipated laboratory saving 1.45 million US$/year from year 3. Author flocculant difference = 9.6 million / 6 million base-case tonnes = 1.60 US$/t. Base-case and LOM figures remain distinct; already-included savings are not deducted again.↩︎
Meteoric Resources, Caldeira DFS Confirms Confidence in Project Fundamentals to Support Offtake and Financing, 31 July 2026, §1.13.1, printed p. 1-63 / PDF p. 103. Source comparisons: flocculant 16.5 to 6.9 million US$/year; reagent quotation changes 25%, 68%, 7%; power 6 to 7.1 US cents/kWh; general expenses 6.26 to 14.80 million US$; anticipated laboratory saving 1.45 million US$/year from year 3. Author flocculant difference = 9.6 million / 6 million base-case tonnes = 1.60 US$/t. Base-case and LOM figures remain distinct; already-included savings are not deducted again.↩︎
Meteoric Resources, Caldeira DFS Confirms Confidence in Project Fundamentals to Support Offtake and Financing, 31 July 2026, Table 5 and Operating Costs, printed/PDF p. 14; repeated in Table 1-20, printed p. 1-73 / PDF p. 113. The table uses source C1 and Q1 2026 cost inputs; site G&A is in the plant framework. Annual figures and unit figures are reproduced, not recomputed from initial capacity.↩︎
Aclara/Hatch and contributing qualified persons, NI 43-101 Technical Report — Carina Project, Goiás, Brazil, effective 20 March 2026, Table 21-3, printed p. 310 / PDF p. 330; Table 22-5, printed p. 320 / PDF p. 340; issuer report-access page. The full supplied PDF is the page-level source. Source totals: mining 1,196.7, plant 738.6, G&A/ESG/logistics 299.1, total 2,234.4 million US$; corresponding reported feed costs 7.0, 4.3, 1.8 and 13.1 US$/t. These are feed costs; the separate REO-column unit-heading issue is not used to recalculate them.↩︎
Aclara/Hatch and contributing qualified persons, NI 43-101 Technical Report — Carina Project, Goiás, Brazil, effective 20 March 2026, §21.3.1 and Table 21-4, printed pp. 310–311 / PDF pp. 330–331; issuer report-access page. The full supplied PDF is the page-level source. The source separates diesel 161.2 and other mine costs 1,035.6 million US$, with total 1,196.7 after rounding, and uses 1.09 US$/litre diesel. Equipment, maintenance, labour, mobilisation and fuel scope is described in §21.3.1.↩︎
Aclara/Hatch and contributing qualified persons, NI 43-101 Technical Report — Carina Project, Goiás, Brazil, effective 20 March 2026, §16.5 and Tables 16-8 to 16-10, printed pp. 185–186 / PDF pp. 205–206; issuer report-access page. Page images of the supplied full report were inspected for this revision. The text distinguishes direct Aclara mine-supervision staff and contractor mining operations. This is not, by itself, evidence of a complete contractor-funded equipment package; no workforce totals or fleet-funding premiums are inferred.↩︎
Aclara/Hatch and contributing qualified persons, NI 43-101 Technical Report — Carina Project, Goiás, Brazil, effective 20 March 2026, §21.3.1 and Table 21-4, printed pp. 310–311 / PDF pp. 330–331; issuer report-access page. The full supplied PDF is the page-level source. The source separates diesel 161.2 and other mine costs 1,035.6 million US$, with total 1,196.7 after rounding, and uses 1.09 US$/litre diesel. Equipment, maintenance, labour, mobilisation and fuel scope is described in §21.3.1.↩︎
Aclara/Hatch and contributing qualified persons, NI 43-101 Technical Report — Carina Project, Goiás, Brazil, effective 20 March 2026, §21.3.2 and Table 21-5, printed p. 311 / PDF p. 331; issuer report-access page. The full supplied PDF is the page-level source. Plant line items, tax/duty and escalation exclusions, and absence of plant OPEX contingency are source statements. Table notes specify 9,713 kt/year dry feed in a nominal standard year; that is distinct from a LOM average.↩︎
Aclara/Hatch and contributing qualified persons, NI 43-101 Technical Report — Carina Project, Goiás, Brazil, effective 20 March 2026, Tables 21-3 and 21-5, printed pp. 310–311 / PDF pp. 330–331; issuer report-access page. The full supplied PDF is the page-level source. Detailed plant total 737.1 versus consolidated 738.6 million US$. The displayed component US$/t values sum to 4.32 versus total 4.31; displayed million-US$ components sum to 737.1, matching the detailed monetary total. Retain reported figures without a balancing item.↩︎
Aclara/Hatch and contributing qualified persons, NI 43-101 Technical Report — Carina Project, Goiás, Brazil, effective 20 March 2026, §21.3.2 and Table 21-5, printed p. 311 / PDF p. 331; issuer report-access page. The full supplied PDF is the page-level source. Plant line items, tax/duty and escalation exclusions, and absence of plant OPEX contingency are source statements. Table notes specify 9,713 kt/year dry feed in a nominal standard year; that is distinct from a LOM average.↩︎
Aclara/Hatch and contributing qualified persons, NI 43-101 Technical Report — Carina Project, Goiás, Brazil, effective 20 March 2026, Table 21-5 notes and Table 21-6, printed pp. 311–312 / PDF pp. 331–332; issuer report-access page. The full supplied PDF is the page-level source. Source annual consumption tonnages and price assumptions are normalised against 9,713,000 dry t/year: kg/t = reagent tonnes × 1,000 / feed; US$/t feed = reagent tonnes × price / feed. Chemical form and source wording retained. Table shows selected rows only and does not replace the LOM reagent total. “Consumption” is the source label; these cost-model quantities are not independently verified fresh-purchase or steady-state make-up measurements.↩︎
Aclara/Hatch and contributing qualified persons, NI 43-101 Technical Report — Carina Project, Goiás, Brazil, effective 20 March 2026, Table 21-5 notes and Table 21-6, printed pp. 311–312 / PDF pp. 331–332; issuer report-access page. The full supplied PDF is the page-level source. Source annual consumption tonnages and price assumptions are normalised against 9,713,000 dry t/year: kg/t = reagent tonnes × 1,000 / feed; US$/t feed = reagent tonnes × price / feed. Chemical form and source wording retained. Table shows selected rows only and does not replace the LOM reagent total. “Consumption” is the source label; these cost-model quantities are not independently verified fresh-purchase or steady-state make-up measurements.↩︎
Aclara/Hatch and contributing qualified persons, NI 43-101 Technical Report — Carina Project, Goiás, Brazil, effective 20 March 2026, Table 21-5 notes and Table 21-6, printed pp. 311–312 / PDF pp. 331–332; issuer report-access page. The full supplied PDF is the page-level source. Source annual consumption tonnages and price assumptions are normalised against 9,713,000 dry t/year: kg/t = reagent tonnes × 1,000 / feed; US$/t feed = reagent tonnes × price / feed. Chemical form and source wording retained. Table shows selected rows only and does not replace the LOM reagent total. “Consumption” is the source label; these cost-model quantities are not independently verified fresh-purchase or steady-state make-up measurements.↩︎
Aclara/Hatch and contributing qualified persons, NI 43-101 Technical Report — Carina Project, Goiás, Brazil, effective 20 March 2026, Table 21-6, printed p. 312 / PDF p. 332; issuer report-access page. The full supplied PDF is the page-level source. The printed resin row is 27 L/year at US$6.5/L versus 3.4 million US$ LOM; the water-treatment row is 50.84 m³/year at US$45/m³ versus 1.0 million US$ LOM. These quantities are not silently multiplied or used as reliable reconstructed purchases. Reported costs remain in the source total.↩︎
Aclara/Hatch and contributing qualified persons, NI 43-101 Technical Report — Carina Project, Goiás, Brazil, effective 20 March 2026, §§17.9–17.11, printed pp. 196–197 / PDF pp. 216–217; issuer report-access page. The full supplied PDF is the page-level source. The design description includes precipitation, nanofiltration, reverse osmosis and ion exchange; washed solids and product filtration/packing also have their own handling steps. This is a source process description, not proof of commercial operation.↩︎
Aclara/Hatch and contributing qualified persons, NI 43-101 Technical Report — Carina Project, Goiás, Brazil, effective 20 March 2026, Table 21-7, printed pp. 312–313 / PDF pp. 332–333; issuer report-access page. The full supplied PDF is the page-level source. Source total electricity cost 214.0 million US$ and load 28.1 MW. Annual operating energy is not inferred by treating MW as MWh.↩︎
Aclara/Hatch and contributing qualified persons, NI 43-101 Technical Report — Carina Project, Goiás, Brazil, effective 20 March 2026, §21.3.2 maintenance discussion and Table 21-8, printed p. 313 / PDF p. 333; issuer report-access page. The full supplied PDF is the page-level source. Source factors 2% and 5% are applied to mechanical equipment supply cost without taxes on the described basis. Contract crews for the annual maintenance shutdown are excluded; maintenance is assumed to cover sustaining CAPEX. No missing shutdown cost is estimated here.↩︎
Aclara/Hatch and contributing qualified persons, NI 43-101 Technical Report — Carina Project, Goiás, Brazil, effective 20 March 2026, §21.3.2 maintenance discussion and Table 21-8, printed p. 313 / PDF p. 333; issuer report-access page. The full supplied PDF is the page-level source. Source factors 2% and 5% are applied to mechanical equipment supply cost without taxes on the described basis. Contract crews for the annual maintenance shutdown are excluded; maintenance is assumed to cover sustaining CAPEX. No missing shutdown cost is estimated here.↩︎
Aclara/Hatch and contributing qualified persons, NI 43-101 Technical Report — Carina Project, Goiás, Brazil, effective 20 March 2026, §21.2 and Table 21-2, printed p. 309 / PDF p. 329; Table 22-4, printed p. 320 / PDF p. 340; issuer report-access page. The full supplied PDF is the page-level source. Source sustaining works include clearance, roads, infill drilling and pit drainage: 56.7 million US$; closure 74.6 million US$. Their scopes must be reconciled with plant maintenance, not assumed identical.↩︎
Aclara/Hatch and contributing qualified persons, NI 43-101 Technical Report — Carina Project, Goiás, Brazil, effective 20 March 2026, §21.3.2 labour discussion, printed p. 313 / PDF p. 333; Table 21-9, printed p. 314 / PDF p. 334; issuer report-access page. The full supplied PDF is the page-level source. Source plant staffing totals 130. The estimate excludes G&A personnel from the plant-labour line; it includes benefits, bonuses and overtime. This does not establish a total all-project workforce.↩︎
Aclara/Hatch and contributing qualified persons, NI 43-101 Technical Report — Carina Project, Goiás, Brazil, effective 20 March 2026, §21.3.2 and Table 21-5, printed p. 311 / PDF p. 331; issuer report-access page. The full supplied PDF is the page-level source. Plant line items, tax/duty and escalation exclusions, and absence of plant OPEX contingency are source statements. Table notes specify 9,713 kt/year dry feed in a nominal standard year; that is distinct from a LOM average.↩︎
Aclara/Hatch and contributing qualified persons, NI 43-101 Technical Report — Carina Project, Goiás, Brazil, effective 20 March 2026, §21.3.1 and Table 21-4, printed pp. 310–311 / PDF pp. 330–331; issuer report-access page. The full supplied PDF is the page-level source. The source separates diesel 161.2 and other mine costs 1,035.6 million US$, with total 1,196.7 after rounding, and uses 1.09 US$/litre diesel. Equipment, maintenance, labour, mobilisation and fuel scope is described in §21.3.1.↩︎
Aclara/Hatch and contributing qualified persons, NI 43-101 Technical Report — Carina Project, Goiás, Brazil, effective 20 March 2026, §21.3.2 labour discussion, printed p. 313 / PDF p. 333; Table 21-9, printed p. 314 / PDF p. 334; issuer report-access page. The full supplied PDF is the page-level source. Source plant staffing totals 130. The estimate excludes G&A personnel from the plant-labour line; it includes benefits, bonuses and overtime. This does not establish a total all-project workforce.↩︎
Aclara/Hatch and contributing qualified persons, NI 43-101 Technical Report — Carina Project, Goiás, Brazil, effective 20 March 2026, §21.3.3 and Table 21-10, printed p. 315 / PDF p. 335; issuer report-access page. The full supplied PDF is the page-level source. Table reproduced on its LOM basis, including salaries 123.5, ESG 36.5 and logistics 34.5 million US$. The reported total is 299.1; printed components sum to 299.0. Source categories are not reallocated.↩︎
Aclara/Hatch and contributing qualified persons, NI 43-101 Technical Report — Carina Project, Goiás, Brazil, effective 20 March 2026, §21.3.3 and Table 21-10, printed p. 315 / PDF p. 335; issuer report-access page. The full supplied PDF is the page-level source. Table reproduced on its LOM basis, including salaries 123.5, ESG 36.5 and logistics 34.5 million US$. The reported total is 299.1; printed components sum to 299.0. Source categories are not reallocated.↩︎
Viridis Mining and Minerals, Colossus DFS Confirms Project Bankability and Execution Readiness, 20 August 2026, processed-feed schedule, p. 32; Table 12, p. 37. Author denominator = 123.5 million dry t / 25 years = 4.94 million t/year. Annual cost lines 16.5, 60.7 and 3.7 million US$ divide by 4.94 to give 3.3401, 12.2874 and 0.7490 US$/t. Published total 81 / 4.94 = 16.3968 US$/t. The annual components sum to 80.9; the printed total is 81. Published period and average columns do not fully close at displayed precision.↩︎
Viridis Mining and Minerals, Colossus DFS Confirms Project Bankability and Execution Readiness, 20 August 2026, processed-feed schedule, p. 32; Table 12, p. 37. Author denominator = 123.5 million dry t / 25 years = 4.94 million t/year. Annual cost lines 16.5, 60.7 and 3.7 million US$ divide by 4.94 to give 3.3401, 12.2874 and 0.7490 US$/t. Published total 81 / 4.94 = 16.3968 US$/t. The annual components sum to 80.9; the printed total is 81. Published period and average columns do not fully close at displayed precision.↩︎
Viridis Mining and Minerals, Colossus DFS Confirms Project Bankability and Execution Readiness, 20 August 2026, “Contract Mining” and “Project Capital Cost Estimate and Procurement” sections. The narrative states an initial 4.74 US$/t ROM contract rate covering mining, haulage, residue backfilling, rehabilitation, fleet maintenance and mining NPI; it states that the initial contract strategy eliminates upfront owner mining-fleet capital and anticipates transition to owner operation in year 4. This review cites those section headings rather than assigning an unconfirmed page number. The later fleet-capital allocation is not independently reconstructed.↩︎
Viridis Mining and Minerals, Colossus DFS Confirms Project Bankability and Execution Readiness, 20 August 2026, “Contract Mining” and “Project Capital Cost Estimate and Procurement” sections. The narrative states an initial 4.74 US$/t ROM contract rate covering mining, haulage, residue backfilling, rehabilitation, fleet maintenance and mining NPI; it states that the initial contract strategy eliminates upfront owner mining-fleet capital and anticipates transition to owner operation in year 4. This review cites those section headings rather than assigning an unconfirmed page number. The later fleet-capital allocation is not independently reconstructed.↩︎
Viridis Mining and Minerals, Colossus DFS Confirms Project Bankability and Execution Readiness, 20 August 2026, processed-feed schedule, p. 32; Table 12, p. 37. Author denominator = 123.5 million dry t / 25 years = 4.94 million t/year. Annual cost lines 16.5, 60.7 and 3.7 million US$ divide by 4.94 to give 3.3401, 12.2874 and 0.7490 US$/t. Published total 81 / 4.94 = 16.3968 US$/t. The annual components sum to 80.9; the printed total is 81. Published period and average columns do not fully close at displayed precision.↩︎
Viridis Mining and Minerals, Colossus DFS Confirms Project Bankability and Execution Readiness, 20 August 2026, “Contract Mining” and “Project Capital Cost Estimate and Procurement” sections. The narrative states an initial 4.74 US$/t ROM contract rate covering mining, haulage, residue backfilling, rehabilitation, fleet maintenance and mining NPI; it states that the initial contract strategy eliminates upfront owner mining-fleet capital and anticipates transition to owner operation in year 4. This review cites those section headings rather than assigning an unconfirmed page number. The later fleet-capital allocation is not independently reconstructed.↩︎
Viridis Mining and Minerals, Colossus DFS Confirms Project Bankability and Execution Readiness, 20 August 2026, Capital Allocation and Expansion Pathway and Table 12, printed/PDF p. 37; royalty scope, p. 36. Source average sustaining/expansion line 10.5 million US$/year / 4.94 million dry t/year = 2.1255 US$/t. Narrative sustaining 6.9 million US$/year and expansion 65 million US$ in years 3–5 are retained as separate descriptions; they do not fully reproduce the rounded combined table average. No royalty-case amount is imported into a standardised physical OPEX.↩︎
Viridis Mining and Minerals, Colossus DFS Confirms Project Bankability and Execution Readiness, 20 August 2026, Processing and Metallurgy, pp. 25 and 28–29; Key Processing Steps and High-Value Refined MREC Product. The described system includes beneficiation, regrind, leaching, CCD, filtration, impurity removal, crude-MREC precipitation, re-dissolution, polishing/solvent extraction and re-precipitation, plus UF/RO water and reagent recovery. The document does not disclose a separate current-DFS dollar allocation for every operation.↩︎
Viridis Mining and Minerals, Colossus DFS Confirms Project Bankability and Execution Readiness, 20 August 2026, Project Operating Costs, printed pp. 35–36 and 39; Table 12, p. 37. Source describes market-informed reagent, energy, logistics and labour inputs. Public combined expenditure is not reverse-engineered into unsupported allocations.↩︎
Viridis Mining and Minerals, Colossus DFS Confirms Project Bankability and Execution Readiness, 20 August 2026, Capital Allocation and Expansion Pathway and Table 12, printed/PDF p. 37; royalty scope, p. 36. Source average sustaining/expansion line 10.5 million US$/year / 4.94 million dry t/year = 2.1255 US$/t. Narrative sustaining 6.9 million US$/year and expansion 65 million US$ in years 3–5 are retained as separate descriptions; they do not fully reproduce the rounded combined table average. No royalty-case amount is imported into a standardised physical OPEX.↩︎
Viridis, Colossus PFS, 9 July 2025, target p. 3 and detailed cost Table 9 p. 19; Viridis Mining and Minerals, Colossus DFS Confirms Project Bankability and Execution Readiness, 20 August 2026, feed p. 32 and detailed cost Table 12, p. 37. PFS inputs 98.5 million dry t, 20 years, 57.7 million US$/year from detailed table; DFS inputs 123.5 million dry t, 25 years, 81 million US$/year. Author costs 57.7/(98.5/20)=11.7157 and 81/(123.5/25)=16.3968 US$/t; difference 4.6810. Historical summary differences are not overwritten.↩︎
Viridis, Colossus PFS, 9 July 2025, target p. 3 and detailed cost Table 9 p. 19; Viridis Mining and Minerals, Colossus DFS Confirms Project Bankability and Execution Readiness, 20 August 2026, feed p. 32 and detailed cost Table 12, p. 37. PFS inputs 98.5 million dry t, 20 years, 57.7 million US$/year from detailed table; DFS inputs 123.5 million dry t, 25 years, 81 million US$/year. Author costs 57.7/(98.5/20)=11.7157 and 81/(123.5/25)=16.3968 US$/t; difference 4.6810. Historical summary differences are not overwritten.↩︎
Viridis Mining and Minerals, Colossus DFS Confirms Project Bankability and Execution Readiness, 20 August 2026, Processing and Metallurgy, pp. 25 and 28–29; Key Processing Steps and High-Value Refined MREC Product. The described system includes beneficiation, regrind, leaching, CCD, filtration, impurity removal, crude-MREC precipitation, re-dissolution, polishing/solvent extraction and re-precipitation, plus UF/RO water and reagent recovery. The document does not disclose a separate current-DFS dollar allocation for every operation.↩︎
Ionic Rare Earths, Makuutu Stage 1 DFS, 20 March 2023, pp. 21–22. Source describes owner-procured contract operation, company provision of equipment/support, and an interim process mass balance used for estimating reagents and consumables.↩︎
Author methodological interpretation, not an issuer cost adjustment. The IFRS Foundation’s IAS 16 overview, “About” section, accessed 22 September 2026, distinguishes equipment asset cost from depreciation; it does not define cash C1. Project-specific evidence is in the fleet-arrangements table and its notes. Equipment funding, contract scope, leases, replacement timing and service productivity require their own reconciliation. No contractor premium, standardised capital-adjusted cost or universal cost advantage is assumed.↩︎
Author methodological interpretation, not an issuer cost adjustment. The IFRS Foundation’s IAS 16 overview, “About” section, accessed 22 September 2026, distinguishes equipment asset cost from depreciation; it does not define cash C1. Project-specific evidence is in the fleet-arrangements table and its notes. Equipment funding, contract scope, leases, replacement timing and service productivity require their own reconciliation. No contractor premium, standardised capital-adjusted cost or universal cost advantage is assumed.↩︎
Meteoric Resources, Caldeira DFS Confirms Confidence in Project Fundamentals to Support Offtake and Financing, 31 July 2026, attached executive summary §1.4.6, printed p. 1-25 / PDF p. 65, and announcement “Costs”, p. 22. The estimate expressly uses an owner-mining solution; additional handling and site duties are identified separately in its cost build-up. The source does not establish that the quoted feed-tonne mining OPEX is a complete fleet acquisition, funding and replacement charge.↩︎
Viridis Mining and Minerals, Colossus DFS Confirms Project Bankability and Execution Readiness, 20 August 2026, “Contract Mining” and “Project Capital Cost Estimate and Procurement” sections. The narrative states an initial 4.74 US$/t ROM contract rate covering mining, haulage, residue backfilling, rehabilitation, fleet maintenance and mining NPI; it states that the initial contract strategy eliminates upfront owner mining-fleet capital and anticipates transition to owner operation in year 4. This review cites those section headings rather than assigning an unconfirmed page number. The later fleet-capital allocation is not independently reconstructed.↩︎
Aclara/Hatch and contributing qualified persons, NI 43-101 Technical Report — Carina Project, Goiás, Brazil, effective 20 March 2026, §16.5 and Tables 16-8 to 16-10, printed pp. 185–186 / PDF pp. 205–206; issuer report-access page. Page images of the supplied full report were inspected for this revision. The text distinguishes direct Aclara mine-supervision staff and contractor mining operations. This is not, by itself, evidence of a complete contractor-funded equipment package; no workforce totals or fleet-funding premiums are inferred.↩︎
Ionic Rare Earths, Makuutu Stage 1 DFS, 20 March 2023, pp. 21–22. Source describes owner-procured contract operation, company provision of equipment/support, and an interim process mass balance used for estimating reagents and consumables.↩︎
Author methodological interpretation, not an issuer cost adjustment. The IFRS Foundation’s IAS 16 overview, “About” section, accessed 22 September 2026, distinguishes equipment asset cost from depreciation; it does not define cash C1. Project-specific evidence is in the fleet-arrangements table and its notes. Equipment funding, contract scope, leases, replacement timing and service productivity require their own reconciliation. No contractor premium, standardised capital-adjusted cost or universal cost advantage is assumed.↩︎
Author calculation from Caldeira DFS-results announcement, 31 July 2026, Table 5, p. 14 and Colossus DFS-results announcement, 20 August 2026, feed p. 32 and Table 12, p. 37. Colossus annual feed = 123.5/25 = 4.94 million dry t; mining = 16.5/4.94 = 3.340081; total = 81/4.94 = 16.396761; remainder = total minus mining = 13.056680 US$/dry t. Caldeira mining 6.04 and total 22.22 give remainder 16.18. Differences before display rounding: mining 2.699919, remainder 3.123320, total 5.823239 US$/t; mining share = 2.699919/5.823239 = 46.3646%. This allocates the numerical gap to source categories, not to causal drivers or comparable fleet-capital costs.↩︎
Author calculation from Caldeira DFS-results announcement, 31 July 2026, Table 5, p. 14 and Colossus DFS-results announcement, 20 August 2026, feed p. 32 and Table 12, p. 37. Colossus annual feed = 123.5/25 = 4.94 million dry t; mining = 16.5/4.94 = 3.340081; total = 81/4.94 = 16.396761; remainder = total minus mining = 13.056680 US$/dry t. Caldeira mining 6.04 and total 22.22 give remainder 16.18. Differences before display rounding: mining 2.699919, remainder 3.123320, total 5.823239 US$/t; mining share = 2.699919/5.823239 = 46.3646%. This allocates the numerical gap to source categories, not to causal drivers or comparable fleet-capital costs.↩︎
Meteoric Resources, Caldeira DFS Confirms Confidence in Project Fundamentals to Support Offtake and Financing, 31 July 2026, attached executive summary §1.4.6, printed p. 1-25 / PDF p. 65, and announcement “Costs”, p. 22. The estimate expressly uses an owner-mining solution; additional handling and site duties are identified separately in its cost build-up. The source does not establish that the quoted feed-tonne mining OPEX is a complete fleet acquisition, funding and replacement charge.↩︎
Viridis Mining and Minerals, Colossus DFS Confirms Project Bankability and Execution Readiness, 20 August 2026, “Contract Mining” and “Project Capital Cost Estimate and Procurement” sections. The narrative states an initial 4.74 US$/t ROM contract rate covering mining, haulage, residue backfilling, rehabilitation, fleet maintenance and mining NPI; it states that the initial contract strategy eliminates upfront owner mining-fleet capital and anticipates transition to owner operation in year 4. This review cites those section headings rather than assigning an unconfirmed page number. The later fleet-capital allocation is not independently reconstructed.↩︎
Meteoric Resources, Caldeira DFS Confirms Confidence in Project Fundamentals to Support Offtake and Financing, 31 July 2026, attached executive summary §1.4.6, printed pp. 1-25–1-26 / PDF pp. 65–66. Source describes ROM-pad, grade-control, ore-haulage and spent-clay-rehandling duties. Road haulage for Figueira and Soberbo is discussed, with pumping evaluated as more costly because of rheology and pumping-power requirements. These statements identify a design basis, not a reconciled dollar saving versus Colossus.↩︎
Viridis Mining and Minerals, Colossus DFS Confirms Project Bankability and Execution Readiness, 20 August 2026, Processing and Metallurgy, pp. 25 and 28–29; Key Processing Steps and High-Value Refined MREC Product. The described system includes beneficiation, regrind, leaching, CCD, filtration, impurity removal, crude-MREC precipitation, re-dissolution, polishing/solvent extraction and re-precipitation, plus UF/RO water and reagent recovery. The document does not disclose a separate current-DFS dollar allocation for every operation.↩︎
Meteoric Resources, Caldeira DFS Confirms Confidence in Project Fundamentals to Support Offtake and Financing, 31 July 2026, Table 5, p. 14. Aclara/Hatch and contributing qualified persons, NI 43-101 Technical Report — Carina Project, Goiás, Brazil, effective 20 March 2026, Tables 21-3 and 21-5, printed pp. 310–311 / PDF pp. 330–331; issuer report-access page. The full supplied PDF is the page-level source. Author differences: 22.22−13.10=9.12; 9.17−1.36=7.81 US$/t. Unequal category definitions prevent causal attribution.↩︎
Meteoric Resources, Caldeira DFS Confirms Confidence in Project Fundamentals to Support Offtake and Financing, 31 July 2026, Table 5, p. 14. Aclara/Hatch and contributing qualified persons, NI 43-101 Technical Report — Carina Project, Goiás, Brazil, effective 20 March 2026, Tables 21-3, 21-5, 21-8 and 21-10, printed pp. 310–315 / PDF pp. 330–335; issuer report-access page. The full supplied PDF is the page-level source. Viridis Mining and Minerals, Colossus DFS Confirms Project Bankability and Execution Readiness, 20 August 2026, Table 12, p. 37, and the “Contract Mining” section. Selected rows retain source scope; Colossus mining is 16.5/4.94. “Not separately disclosed” refers to the admitted cost table, not a claim that no underlying engineering allocation exists.↩︎
Meteoric Resources, Caldeira DFS Confirms Confidence in Project Fundamentals to Support Offtake and Financing, 31 July 2026, §1.13, printed p. 1-62 / PDF p. 102. The engineering base case is 6 Mt/year; reagent quantities come from mass balance and delivered supplier quotations. Power is 7.1 US cents/kWh including taxes. Figure 1-30 is a base-case distribution, not the LOM Table 5 cost allocation.↩︎
Aclara/Hatch and contributing qualified persons, NI 43-101 Technical Report — Carina Project, Goiás, Brazil, effective 20 March 2026, §21.3.2 and Table 21-5, printed p. 311 / PDF p. 331; issuer report-access page. The full supplied PDF is the page-level source. Plant line items, tax/duty and escalation exclusions, and absence of plant OPEX contingency are source statements. Table notes specify 9,713 kt/year dry feed in a nominal standard year; that is distinct from a LOM average.↩︎
Meteoric Resources, Caldeira DFS Confirms Confidence in Project Fundamentals to Support Offtake and Financing, 31 July 2026, Table 5, p. 14. Author sum of source fixed-plant lines: 1.83+1.23+1.15=4.21 US$/dry t. This is not a complete company-wide fixed-cost classification.↩︎
Meteoric Resources, Caldeira DFS Confirms Confidence in Project Fundamentals to Support Offtake and Financing, 31 July 2026, Table 5, p. 14, source fixed-plant categories. Analyst illustration only: unchanged annual fixed block; relative throughput 1.0, 0.9 and 0.8. Fixed allocation 4.21/q gives 4.21, 4.6778 and 5.2625 US$/t; increases 0, 0.4678 and 1.0525. This is neither an issuer operating forecast nor an estimate for a resized plant.↩︎
Meteoric Resources, Caldeira DFS Confirms Confidence in Project Fundamentals to Support Offtake and Financing, 31 July 2026, Table 5, p. 14, source fixed-plant categories. Analyst illustration only: unchanged annual fixed block; relative throughput 1.0, 0.9 and 0.8. Fixed allocation 4.21/q gives 4.21, 4.6778 and 5.2625 US$/t; increases 0, 0.4678 and 1.0525. This is neither an issuer operating forecast nor an estimate for a resized plant.↩︎
Meteoric Resources, Caldeira DFS Confirms Confidence in Project Fundamentals to Support Offtake and Financing, 31 July 2026, §1.13, printed p. 1-62 / PDF p. 102. The engineering base case is 6 Mt/year; reagent quantities come from mass balance and delivered supplier quotations. Power is 7.1 US cents/kWh including taxes. Figure 1-30 is a base-case distribution, not the LOM Table 5 cost allocation.↩︎
Meteoric Resources, Caldeira DFS Confirms Confidence in Project Fundamentals to Support Offtake and Financing, 31 July 2026, Table 5 and Operating Costs, printed/PDF p. 14; repeated in Table 1-20, printed p. 1-73 / PDF p. 113. The table uses source C1 and Q1 2026 cost inputs; site G&A is in the plant framework. Annual figures and unit figures are reproduced, not recomputed from initial capacity.↩︎
Ionic Rare Earths, Makuutu Stage 1 DFS, 20 March 2023, Table 1 p. 5 and OPEX discussion p. 21; Stage 1 DFS Clarification, 24 March 2023, p. 1. Original detail explicitly identifies dry feed and calls the tonne figure OPEX; headline/clarification use AISC at approximately US$12.40/t ROM. Clarification includes transport through Mombasa to a nominated US East Coast location. No C1 relabelling or current-dollar rebasing.↩︎
Ionic Rare Earths, Makuutu Stage 1 DFS, 20 March 2023, pp. 21–22. Source describes owner-procured contract operation, company provision of equipment/support, and an interim process mass balance used for estimating reagents and consumables.↩︎
Ionic Rare Earths, Makuutu Stage 1 DFS, 20 March 2023, Figure 16 p. 22. Original OPEX shares: mining 27%, reagents 35%, processing/environment 26%, G&A 12%. No multiplication into clarified AISC is performed.↩︎
Ionic Rare Earths, Makuutu Stage 1 DFS, 20 March 2023, Table 1 p. 5. Reported mining 757 + processing 1,309 + G&A 260 = 2,326 million US$, versus printed total 2,143. The review preserves the source issue; this is not a revised estimate.↩︎
Harena Rare Earths, Completion of Pre-Feasibility Study, 26 January 2026, Important note and Project Design and Philosophy; unpaginated issuer RNS. Source states Measured/Indicated basis, no Mineral Reserve yet estimated, and uncertain future outcomes. Describes agglomerated heaps, irrigation, solution treatment and spent-material return; no claim of a DFS or demonstrated operation.↩︎
Harena Rare Earths, Completion of Pre-Feasibility Study, 26 January 2026, §1.13 Table 4 and preceding estimation-basis paragraphs. Source ROM components 9.6, 11.9, 5.7 and 3.9 sum to 31.1 US$/t. WBS means work breakdown structure. No allocation of unidentified other costs is assumed.↩︎
Harena Rare Earths, Completion of Pre-Feasibility Study, 26 January 2026, §1.13 Table 4 and preceding estimation-basis paragraphs. Source ROM components 9.6, 11.9, 5.7 and 3.9 sum to 31.1 US$/t. WBS means work breakdown structure. No allocation of unidentified other costs is assumed.↩︎
Harena Resources, “Completion of Pre-Feasibility Study”, 26 January 2026, “Financial Evaluation Assumptions”. Unpaginated issuer RNS text states that ex-Madagascar transport to the separation-plant customer is reflected within the estimated payability factor. The cost article identifies that boundary without importing commodity prices or calculating revenue.↩︎
Harena Rare Earths, Completion of Pre-Feasibility Study, 26 January 2026, Project Design and Philosophy (88 million dry tonnes) and §1.13 Table 4. Author checks: annual 42.2+52.5+25.1+19.2=139.0 vs stated 136.9 million US$; LOM 844.8+1,050.6+499.5+343.9=2,738.8 vs 2,743. The Table 4 ROM label is retained without an invented moisture conversion.↩︎
BCM, Ema BFS, 30 June 2026, Operating Cost Estimate, p. 17 immediately before Table 10; route/reagent/hydrogeology discussion, pp. 19–21 and 25–26. Wellfield OPEX is explicitly included as an all-in G&A rate over mine life. This edition intentionally omits numerical Ema cost and production forecasts, retaining qualitative route and cost-scope context only.↩︎
Australian Rare Earths, Quarterly Activities Report for the three months ending 30 June 2026, released 31 July 2026, Capital and Operating Costs and PFS discussion; unpaginated issuer-authored reproduction. Used for route context only. No original granular PFS or derived feed-tonne result is admitted.↩︎
Aclara Resources, Aclara Receives Approval of Environmental Impact Assessment in Chile, 9 June 2026; Next Steps section; unpaginated issuer announcement. View cited source. USA Rare Earth, USA Rare Earth Announces Definitive Agreement to Acquire Serra Verde Group, 20 April 2026; opening release and production footnotes, printed pp. 1–3; non-GAAP discussion, printed p. 6, in the filed HTML exhibit. View cited source. These document-specific exclusions are not a claim that no later or other disclosure exists.↩︎
SVRE/USA Rare Earth, supplemental operating and financial disclosures, SEC-filed exhibit 99.2, accession 0001213900-26-055511, cost-of-sales discussion and cash-cost definition; and SVRE audited financial statements, exhibit 99.3 in the same filing, inventory policies and administrative expenses. These sources were reviewed in the preceding Serra Verde research; this revision retains only the qualitative evidence boundary, not a freshly reconstructed unit operating cost or a new transaction forecast.↩︎
Meteoric Resources, Caldeira DFS Confirms Confidence in Project Fundamentals to Support Offtake and Financing, 31 July 2026, §1.17.5 and Tables 1-21–1-22, printed p. 1-75 / PDF p. 115; Table 5 p. 14. Source model assumes imported-reagent ICMS exemption under its export condition. Royalty and government-impost treatment is reported as source scope, not current legal advice or a ruling on Magnes.↩︎
Viridis Mining and Minerals, Colossus DFS Confirms Project Bankability and Execution Readiness, 20 August 2026, Capital Allocation and Expansion Pathway and Table 12, printed/PDF p. 37; royalty scope, p. 36. Source average sustaining/expansion line 10.5 million US$/year / 4.94 million dry t/year = 2.1255 US$/t. Narrative sustaining 6.9 million US$/year and expansion 65 million US$ in years 3–5 are retained as separate descriptions; they do not fully reproduce the rounded combined table average. No royalty-case amount is imported into a standardised physical OPEX.↩︎
Meteoric Resources, Caldeira DFS Confirms Confidence in Project Fundamentals to Support Offtake and Financing, 31 July 2026, §1.17.5 and Tables 1-21–1-22, printed p. 1-75 / PDF p. 115; Table 5 p. 14. Source model assumes imported-reagent ICMS exemption under its export condition. Royalty and government-impost treatment is reported as source scope, not current legal advice or a ruling on Magnes.↩︎
Meteoric Resources, Caldeira DFS Confirms Confidence in Project Fundamentals to Support Offtake and Financing, 31 July 2026, §1.13, printed p. 1-62 / PDF p. 102. The engineering base case is 6 Mt/year; reagent quantities come from mass balance and delivered supplier quotations. Power is 7.1 US cents/kWh including taxes. Figure 1-30 is a base-case distribution, not the LOM Table 5 cost allocation.↩︎
Aclara/Hatch and contributing qualified persons, NI 43-101 Technical Report — Carina Project, Goiás, Brazil, effective 20 March 2026, §21.3.2 and Table 21-5, printed p. 311 / PDF p. 331; issuer report-access page. The full supplied PDF is the page-level source. Plant line items, tax/duty and escalation exclusions, and absence of plant OPEX contingency are source statements. Table notes specify 9,713 kt/year dry feed in a nominal standard year; that is distinct from a LOM average.↩︎
Aclara/Hatch and contributing qualified persons, NI 43-101 Technical Report — Carina Project, Goiás, Brazil, effective 20 March 2026, §22.2.8 and Table 22-6, printed p. 322 / PDF p. 342; Table 22-8, printed p. 329 / PDF p. 349; issuer report-access page. The full supplied PDF is the page-level source. Source distinguishes taxes, credits and cash-flow entries. No tax rate or legal exemption is applied to another project here.↩︎
Author methodological interpretation, not an issuer cost adjustment. The IFRS Foundation’s IAS 16 overview, “About” section, accessed 22 September 2026, distinguishes equipment asset cost from depreciation; it does not define cash C1. Project-specific evidence is in the fleet-arrangements table and its notes. Equipment funding, contract scope, leases, replacement timing and service productivity require their own reconciliation. No contractor premium, standardised capital-adjusted cost or universal cost advantage is assumed.↩︎
Viridis Mining and Minerals, Colossus DFS Confirms Project Bankability and Execution Readiness, 20 August 2026, “Contract Mining” and “Project Capital Cost Estimate and Procurement” sections. The narrative states an initial 4.74 US$/t ROM contract rate covering mining, haulage, residue backfilling, rehabilitation, fleet maintenance and mining NPI; it states that the initial contract strategy eliminates upfront owner mining-fleet capital and anticipates transition to owner operation in year 4. This review cites those section headings rather than assigning an unconfirmed page number. The later fleet-capital allocation is not independently reconstructed.↩︎
Aclara/Hatch and contributing qualified persons, NI 43-101 Technical Report — Carina Project, Goiás, Brazil, effective 20 March 2026, §21.3.2 maintenance discussion and Table 21-8, printed p. 313 / PDF p. 333; issuer report-access page. The full supplied PDF is the page-level source. Source factors 2% and 5% are applied to mechanical equipment supply cost without taxes on the described basis. Contract crews for the annual maintenance shutdown are excluded; maintenance is assumed to cover sustaining CAPEX. No missing shutdown cost is estimated here.↩︎
Aclara/Hatch and contributing qualified persons, NI 43-101 Technical Report — Carina Project, Goiás, Brazil, effective 20 March 2026, §21.2 and Table 21-2, printed p. 309 / PDF p. 329; Table 22-4, printed p. 320 / PDF p. 340; issuer report-access page. The full supplied PDF is the page-level source. Source sustaining works include clearance, roads, infill drilling and pit drainage: 56.7 million US$; closure 74.6 million US$. Their scopes must be reconciled with plant maintenance, not assumed identical.↩︎
Viridis Mining and Minerals, Colossus DFS Confirms Project Bankability and Execution Readiness, 20 August 2026, Capital Allocation and Expansion Pathway and Table 12, printed/PDF p. 37; royalty scope, p. 36. Source average sustaining/expansion line 10.5 million US$/year / 4.94 million dry t/year = 2.1255 US$/t. Narrative sustaining 6.9 million US$/year and expansion 65 million US$ in years 3–5 are retained as separate descriptions; they do not fully reproduce the rounded combined table average. No royalty-case amount is imported into a standardised physical OPEX.↩︎
Carina full report read from the supplied PDF; official issuer page links the same document identifier. Selected mining-workforce and cost pages were inspected locally for this revision; ordinary anonymous full-file reader access was not established. Other selected primary source text was reopened through the web reader; some PDF screenshot requests and all container-network downloads failed. Those failures are not labelled broken public links. The detailed Koppamurra PFS hold remains.↩︎
SEC, Commission Guidance on the Use of Company Web Sites, Release 34-58288, effective 7 August 2008, §II.B.2, especially printed/PDF pp. 35–37. Explains why disclaimers alone do not insulate a company from responsibility for third-party hyperlinked information. The observation is not a conclusion that any particular link here has been legally adopted.↩︎
U.S. Securities and Exchange Commission, Modernization of Property Disclosures for Mining Registrants: A Small Entity Compliance Guide, sections on Subpart 1300 applicability, qualified persons and technical report summaries. Reference identifies the regulatory framework; it is not a representation that this article meets a filing requirement.↩︎
U.S. Code, official 2024 edition: 15 U.S.C. §77z-2, pp. 169–170 / PDF pp. 1–2 and §78u-5, pp. 436–438 / PDF pp. 1–3, especially (a)–(c). These provide accessible official text on issuer eligibility, exclusions and private-action protection; current applicability and transaction facts require counsel’s confirmation. No universal safe harbour is asserted.↩︎
Canadian Securities Administrators, NI 43-101, consolidated effective 9 June 2023, §§2.1–2.3 (printed pp. 5–7 / PDF pp. 7–9), §§3.1–3.5, §4.2 and §6.4. The ASC register distinguishes current text from proposals. Section 2.1’s property-materiality wording and §2.3’s restrictions require separate applicability analysis; the article does not claim a blanket third-party-research exemption.↩︎
NI 51-102, Continuous Disclosure Obligations, Parts 4A and 4B and §5.8; unpaginated consolidated legislation. Applicable reasonable-basis, assumption, risk and updating requirements must be assessed for the actual publisher and disclosure.↩︎
NI 52-112, Non-GAAP and Other Financial Measures Disclosure, consolidated effective 9 June 2023, §§2–4 (scope and exceptions), and §§6–11 (measure-specific requirements); printed pp. 3–4 and 6–10 / PDF pp. 4–5 and 7–11. Applicability and exceptions require counsel’s assessment; a general non-GAAP caution is not a blanket exemption.↩︎
Australian Securities and Investments Commission, Information Sheet 214 — Mining and resources: Forward-looking statements, Legal requirements and What is a forward-looking statement? sections; unpaginated. Addresses reasonable grounds and the limits of qualifications and disclaimers.↩︎
ASX, Guidance Note 31 — Reporting on Mining Activities, §2.6, printed/PDF p. 7, and §8. The proximity and prominence guidance is cited as a publication control where relevant, not as a claim that Magnes is an ASX-listed entity.↩︎
Magnes investor updates
Stay informed about Magnes
Receive public company announcements, technical updates and new presentations by email.
Confirm your email to subscribe. Unsubscribe at any time.